ShmoopTube
Where Monty Python meets your 10th grade teacher.
Search Thousands of Shmoop Videos
Data Representation Videos 15 videos

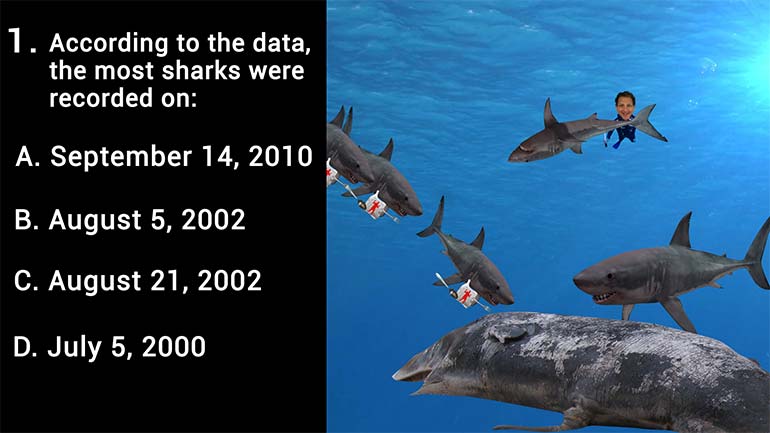
According to the data, the most sharks were recorded on:
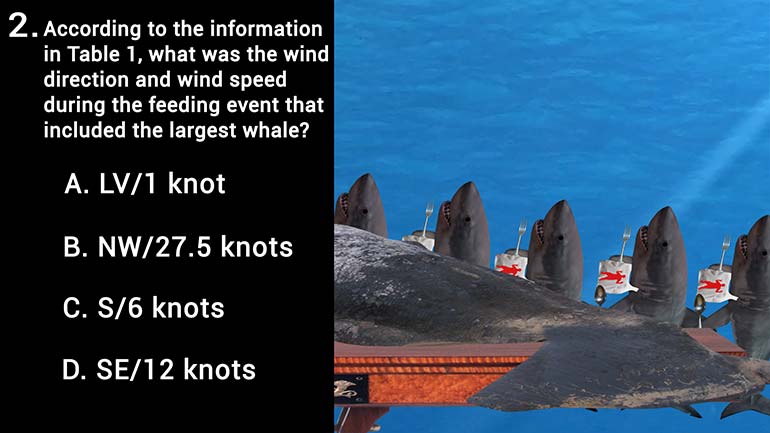
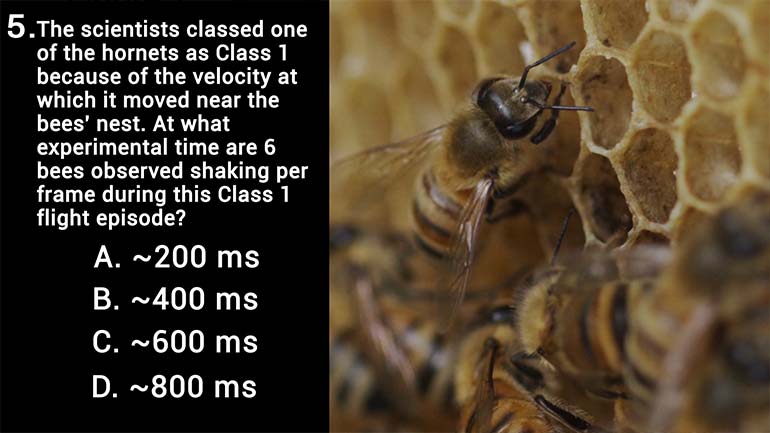
According to the information in Table 1, what was the wind direction and wind speed during the feeding event that included the largest whale?
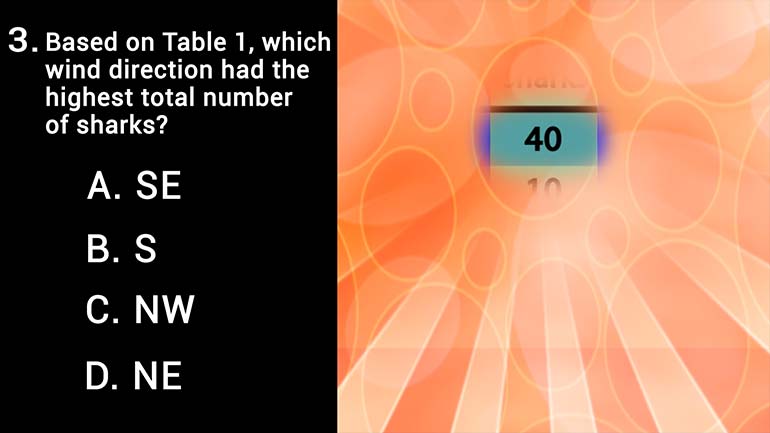
Based on Table 1, which wind direction had the highest total number of sharks?
ACT Aspire Science: Wind Speed and Shark Size 6 Views
Share It!
Description:
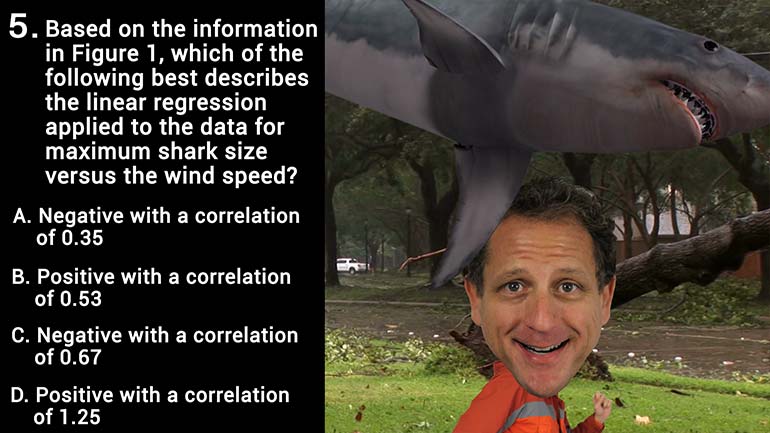
Based on the information in Figure 1, which of the following best describes the linear regression applied to the data for maximum shark size versus the wind speed?
Transcript
- 00:00
Yeah Oh Table one below shows the recorder data from
- 00:10
each scavenging event in this study that whale species in
- 00:14
size and wind direction and speed and figure one illustrates
- 00:20
that relationship of wind speed Teo Maximum shark's eyes straight
- 00:24
line and figure one is a linear regression fit to
Full Transcript
- 00:27
the data points to illustrate a direct relationship between wind
- 00:30
speed and maximum shark sides All right next up based
- 00:35
on the information and figure one Which of the following
- 00:38
best describes the linear regression applied to the data for
- 00:41
maximum shark's eyes versus the wind speed We're going struck
- 00:47
size one side of the equation here in wind speed
- 00:50
on the other list of Graff So the question originally
- 00:53
made us want to run for cover from Sharknado or
- 00:57
Meg NATO the Mega Ladan storm that's coming soon you
- 01:00
know Then we realized the sharks weren't being picked up
- 01:03
and thrown around by that wind instead Well heavier winds
- 01:07
are probably carrying the oh so aromatic scent of dead
- 01:09
whale farther across the ocean and thereby drawing more sharks
- 01:13
to feeding event And many people don't realize this but
- 01:17
there's a new Chanel number six coming out called Dead
- 01:20
Whale Yeah well you see the commercial well As wind
- 01:23
speed increases so does the maximum shark's eyes So this
- 01:27
is a positive correlation or positive relationship Now eliminate all
- 01:31
answer choices that are negative like Kimber today and see
- 01:34
their goodbye in a negative relationship There's just no communication
- 01:38
People just go their own separate await a different kind
- 01:41
of thing Yeah mathematically That means maximum shark's eyes would
- 01:45
decrease as the wind speed increased Write thie r squared
- 01:49
value known as the coefficient of determination It would be
- 01:53
shown on the graph as point five three as in
- 01:56
B Well thiss value help Scientists understand how well that
- 01:59
data fits their predictions that the data is directly related
- 02:03
The point will fit the line nearly perfectly Like you'd
- 02:06
say That's an r squared correlation of one The higher
- 02:10
the number as being positive means everything is kind of
- 02:13
map through the same line If the relationships more complex
- 02:16
on his obvious Nona's directly well correlated and a linear
- 02:20
regression line tends to not run through a large fraction
- 02:24
The point like they're all scattered around it like an
- 02:26
ugly cloud Yeah well the more points a trend line
- 02:29
runs through the higher the r squared number the more
- 02:32
predictable it is And basically what this chart is telling
- 02:35
us is that as wind speed increases more dead whale
- 02:39
sentence and way out into the ocean tracts bigger and
- 02:42
bigger sharks to that dead well so that's it The 00:02:45.69 --> [endTime] answer is B positive correlation point five three
Related Videos
According to the data, the most sharks were recorded on:
According to the information in Table 1, what was the wind direction and wind speed during the feeding event that included the largest whale?
Based on Table 1, which wind direction had the highest total number of sharks?
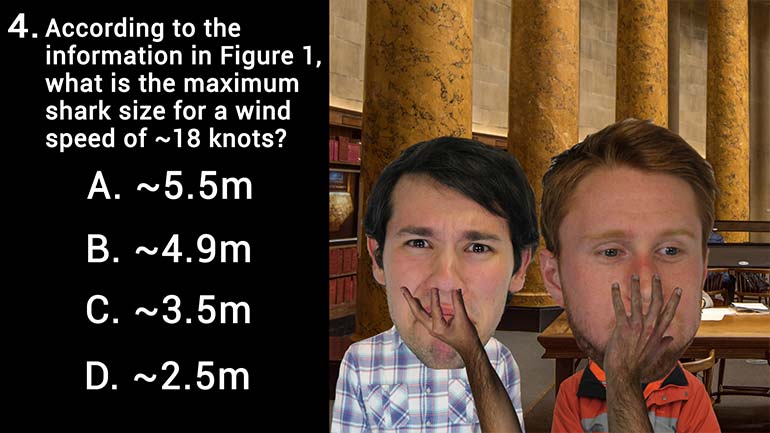
According to the information in Figure 1, what is the maximum shark size for a wind speed of ~18 knots?

Based on the information in Figure 1, the Sharps Formation is located in which epoch?