ShmoopTube
Where Monty Python meets your 10th grade teacher.
Search Thousands of Shmoop Videos
AP Statistics Videos 32 videos
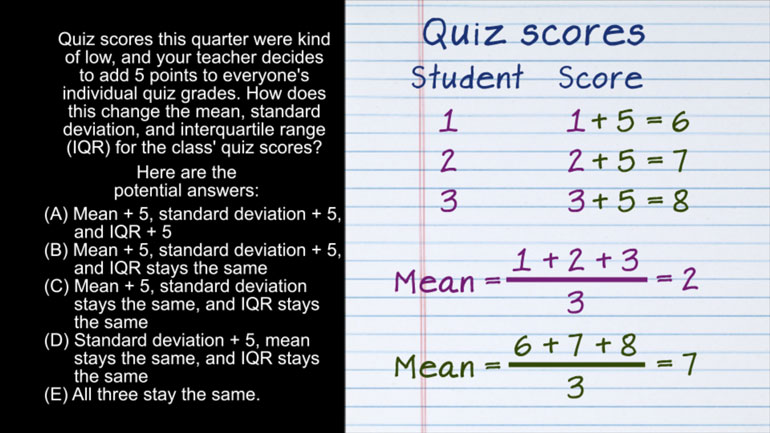
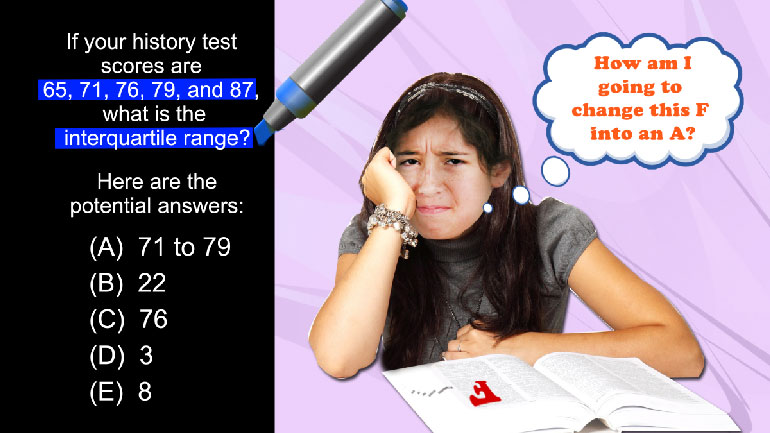
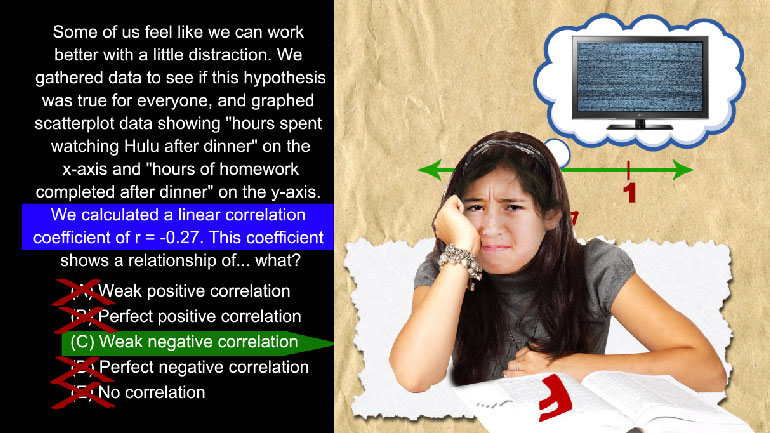
AP Statistics 2.1 Exploring Data. How does this change affect the mean, standard deviation, and IQR?
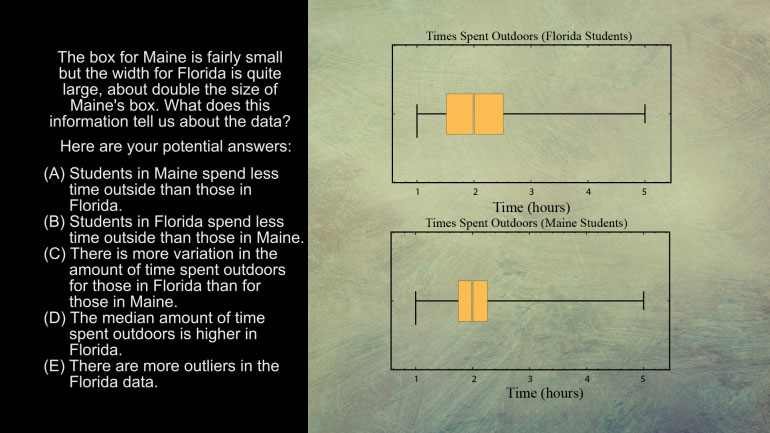
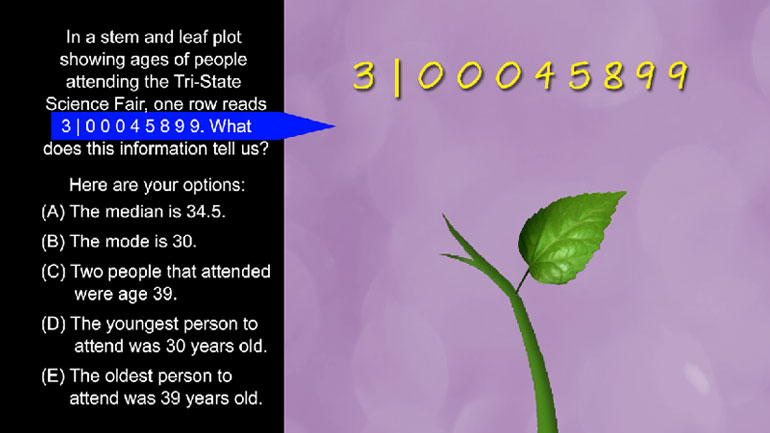
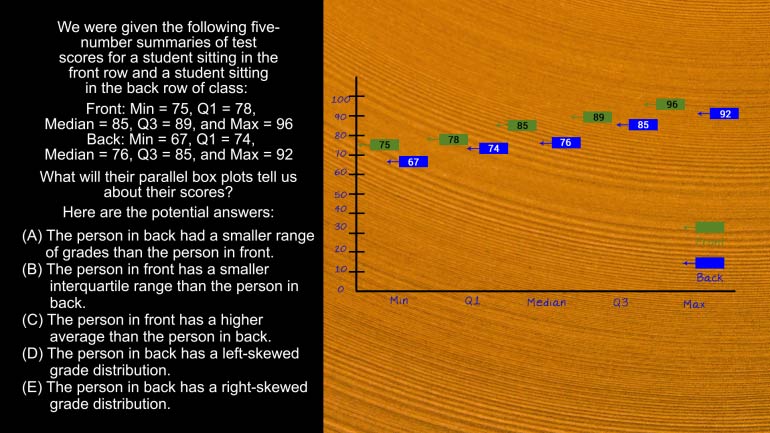
AP Statistics 5.1 Exploring Data. What does this information tell us about the data?
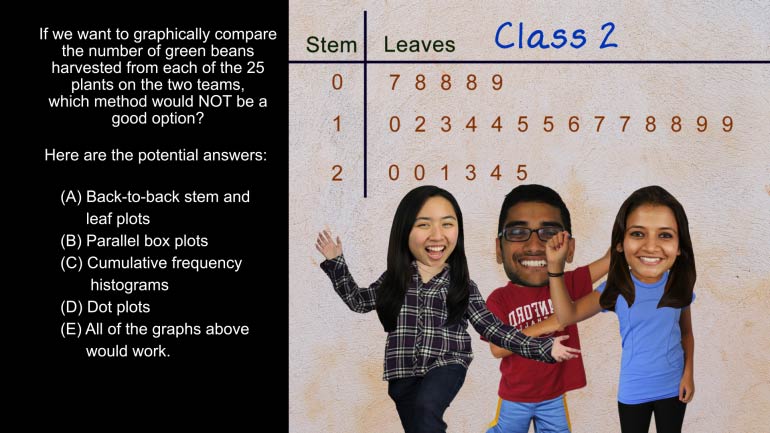
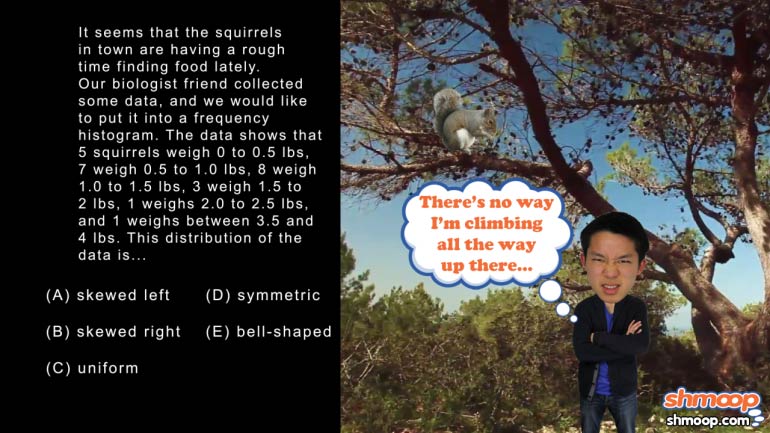
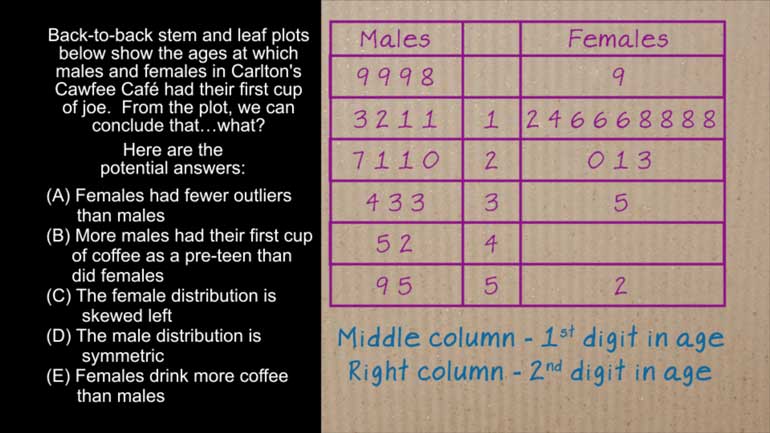
AP Statistics 5.2 Exploring Data. Which method would not be a good option?
AP Statistics 1.4 Exploring Data 175 Views
Share It!
Description:
AP Statistics 1.4 Exploring Data. For any collection of data, the mean must equal the median if the distribution is which of the following?
Transcript
- 00:00
Thank you We sneak And here's your shmoop twos you're
- 00:05
brought to you by collections of data it's cheaper than
- 00:09
an obsession with the troll dolls anyway that come from
- 00:13
all right for any collection of data the mean must
- 00:16
equal the median if the distribution is which of the
Full Transcript
- 00:20
following right here potential answers last rites metric that's like
- 00:24
our last physical doctor with all righty So a pretty
- 00:29
general question here about plotting data where we need to
- 00:32
know the definition of two terms mean and media will
- 00:36
mean is the same as average while median is of
- 00:40
course that thing you drive over when you realize you
- 00:42
missed your left turn All right in this case it's
- 00:45
probably referring to the middle value in a set In
- 00:47
other words if we have the data set zero one
- 00:49
two three nine then the meaner average would be three
- 00:54
but our median would be too well Since we've already
- 00:59
identified a situation where the meaning the median would not
- 01:02
be equal we can go ahead and cross off option
- 01:04
e Well what about d mean can never equal the
- 01:08
median Well let's consider a situation in which we're plotting
- 01:11
the number of times You and four of your friends
- 01:14
have been born Hopefully you've all been born exactly once
- 01:18
We're not counting that time Your buddy martin had an
- 01:20
enlightening summer at church camp Okay so our data set
- 01:23
would be one juan juan one one the mean is
- 01:26
one but so is the media So d can't be
- 01:29
right So we know the mean can equal the median
- 01:33
sometimes Now to see whether our history graham would necessarily
- 01:36
skew left or right Well suppose we're plotting the number
- 01:40
of times three dogs have thrown up on the carpet
- 01:43
slugger has thrown up only once rico just twice But
- 01:46
bonzo seems to be making a habit of it having
- 01:49
thrown up in astounding two hundred ninety seven times and
- 01:52
lived to tell about it The meanest one hundred that's
- 01:55
three hundred but they're divided by three and that gets
- 02:01
you hundred see him take very clever Well the media
- 02:03
is just too because in the middle so here's an
- 02:05
example in the data skews left but the mean in
- 02:07
median are not necessarily equal so but by option a
- 02:12
we can easily imagine a scenario where the reverse is
- 02:14
true and the data skews right with unequal mean and
- 02:18
medium so we can cross off be using the same
- 02:20
logic which leaves only option c The main in the
- 02:23
median must be equal if the data is symmetric This
- 02:27
makes sense because with symmetric data each value on the
- 02:31
left will be a ce far away from the mean
- 02:33
and median as its corresponding value on the right Like
- 02:37
if we're plotting banana peels slipped on by five people
- 02:39
and the data looks like this are mean is six
- 02:43
and so is our media Well the number two is
- 02:46
four units away from the media and so is ten
- 02:49
well in the same way for an eight are both
- 02:51
two units away from the data's middle Both sides match
- 02:54
up or our symmetric well here's hoping the next time
- 02:58
you come upon a banana peel you don't uh skew 00:03:00.61 --> [endTime] downward Wait
Related Videos
AP Statistics 2.1 Exploring Data. How does this change affect the mean, standard deviation, and IQR?
AP Statistics 5.1 Exploring Data. What does this information tell us about the data?
AP Statistics 5.2 Exploring Data. Which method would not be a good option?
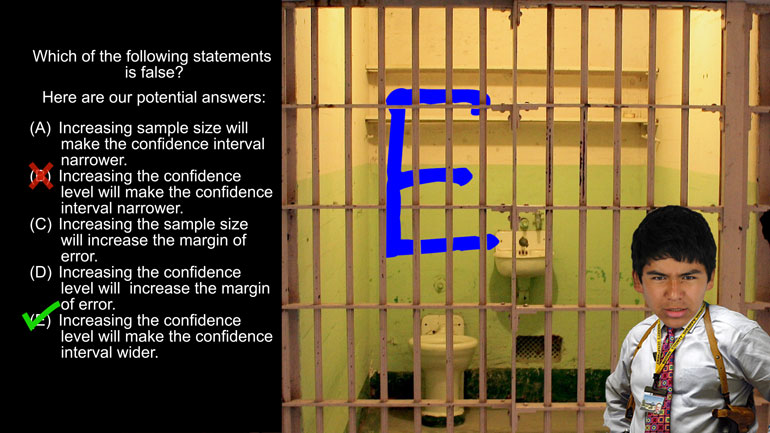
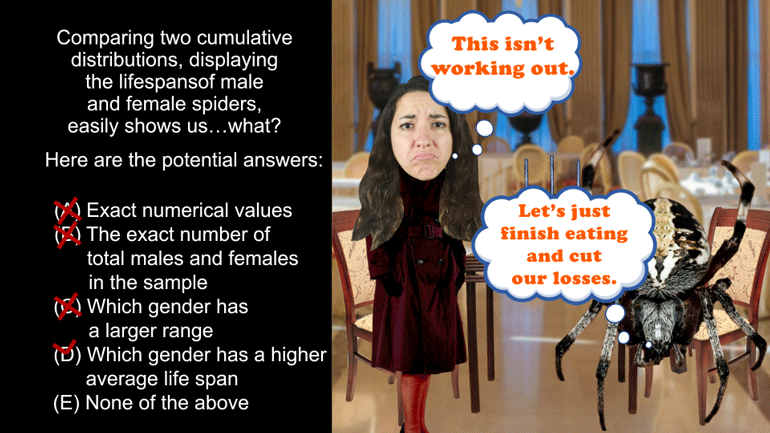
AP Statistics 1.5 Statistical Inference. Which of the following statements is false?
Want to pull an Oliver Twist and ask us for more? We've gotcha covered. Head over to /video/subjects/math/test-prep/ap-statistics/ for more AP...
