ShmoopTube
Where Monty Python meets your 10th grade teacher.
Search Thousands of Shmoop Videos
Exploring Data Videos 25 videos
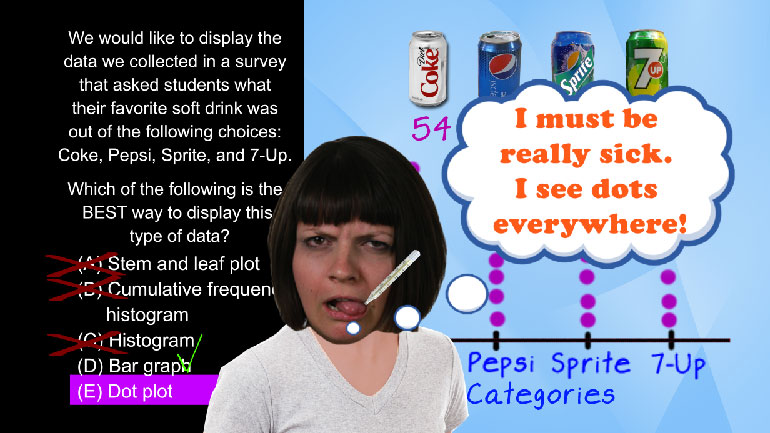
AP Statistics: Exploring Data Drill 1, Problem 2. Which of the following is the best way to display this type of data?
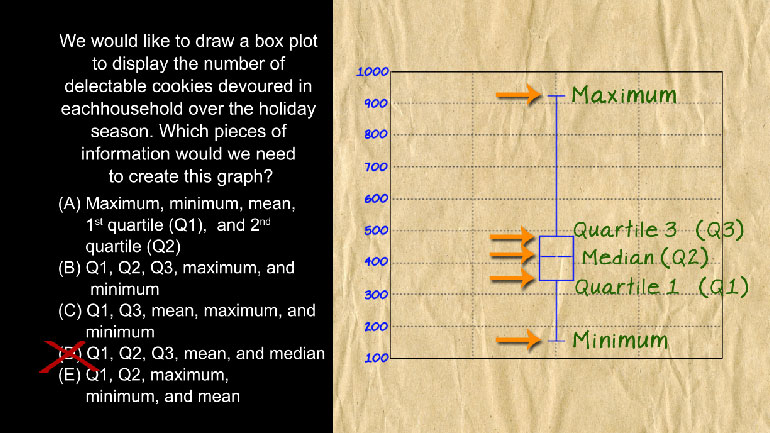
AP Statistics: Exploring Data Drill 1, Problem 5. Which pieces of information would we need to create this graph?
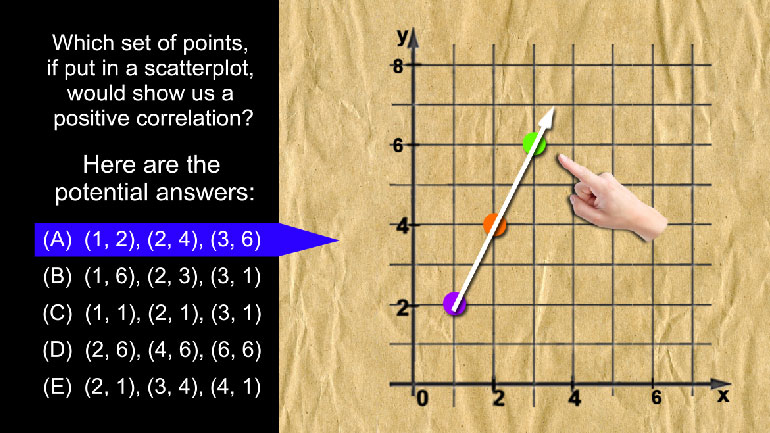
AP Statistics: Exploring Data Drill 2, Problem 3. Which set of points, if put in a scatterplot, would show us a positive correlation?
AP Statistics 4.5 Exploring Data 13 Views
Share It!
Description:
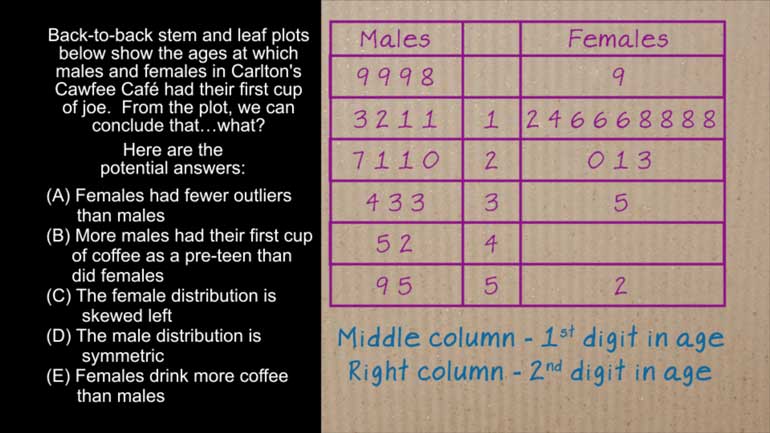
AP Statistics 4.5 Exploring Data. What can we conclude from the plot?
Transcript
- 00:04
And here's your shmoop du jour brought to you by your cup of coffee which is
- 00:07
now lukewarm you're welcome for the java update back-to-back stem and leaf plots [Girl with a lukewarm cup of coffee and java logo appears]
- 00:12
below show the ages at which males and females and Carlton's coffee cafe had
- 00:18
their first cup of joe from the plot we can conclude that what and here the
- 00:23
potential answers..... Okay back-to-back stem and leaf plots well will they go for
Full Transcript
- 00:31
the three-peat sorry so you may be watching too much sports center alright [Men presenting sports center]
- 00:35
so first things first let's break down what this thing is telling us we've got
- 00:38
males on the left and females on the right calm down this isn't an orthodox [Guys standing on the left and girls on the right holding 'Dont' segregate us' signs]
- 00:42
wedding well the middle column tells us the first digit in the age of each
- 00:46
individual while each number to the right or left help us the second digit
- 00:50
in each person's age for example because there's no number in the middle column [Middle column of table circled green]
- 00:55
first row we can assume that there are three 9 year old males and one 8 year old male
- 01:01
and one 9 year old female then in the second row every age starts with a
- 01:06
one we've got males aged 13 12 11 11 and females aged 12 14 16 and so on a lot of [Man wipes sweat from his forehead]
- 01:14
them and we're running out of breath.... so now to our answer
- 01:18
choices...And we conclude that A female had fewer outliers than males well according
- 01:23
to this stem and leaf plot nearly all females have their first cup of joe
- 01:26
during their teenage years with some of those older ones being considered
- 01:30
outliers whereas with the boys they're all pretty spread out making it harder
- 01:35
to identify any of them as outliers in fact it's going to be harder to identify [Men wearing balaclava's over their face]
- 01:38
them at all as long as they are wearing those ski masks over their heads yeah
- 01:42
okay how about C; is the female distribution skewed left no just the
- 01:47
opposite with a bunch of apparently bleary-eyed stressed-out teenagers [Girl drinking a cup of coffee]
- 01:50
pounding the job out of the distribution is actually skewed right so we can
- 01:54
eliminate C.. Can we conclude that the male distribution is
- 01:58
symmetric no.. see how there are fewer males of the older ages yeah that tells
- 02:02
us there is no symmetry here so buh-bye D... what about E females drink more coffee
- 02:07
than males...all we're being told here is the ages at which people [A restroom with a linear graph]
- 02:12
take their first sip, we have no idea whether they try it once they are done-zo
- 02:18
or if they're suddenly hooked for life, so E aint it no the only thing we [Girls dressed as zombies]
- 02:22
know for sure is B more males have the first cup of coffee as a preteen than
- 02:28
did females, right here 4 guys one gal answer B.. done well there you go some
- 02:34
free marketing research for you starbucks, you're welcome [Zombie man and girl chase a starbucks employee]
Related Videos
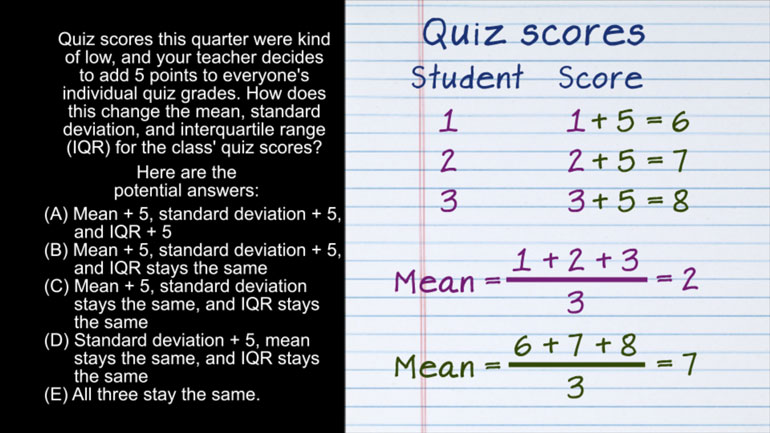
AP Statistics 2.1 Exploring Data. How does this change affect the mean, standard deviation, and IQR?
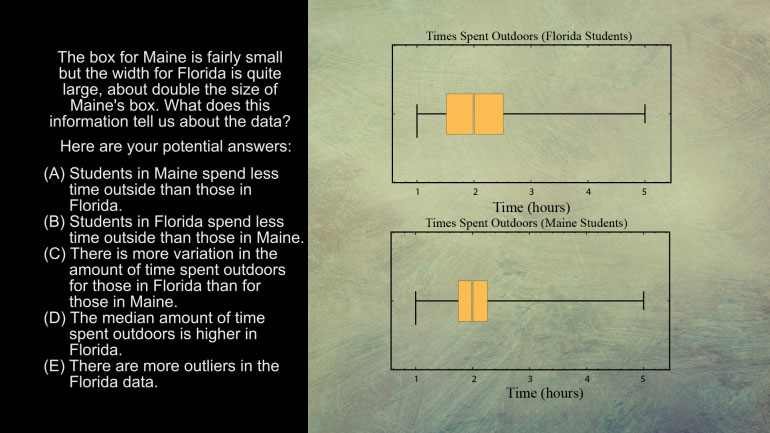
AP Statistics 5.1 Exploring Data. What does this information tell us about the data?
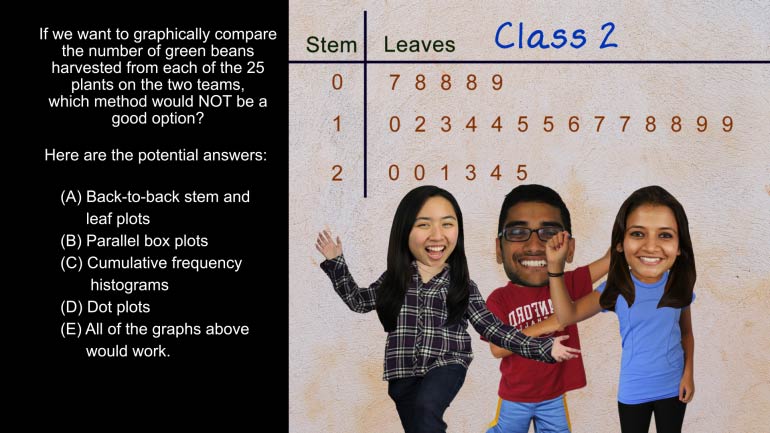
AP Statistics 5.2 Exploring Data. Which method would not be a good option?
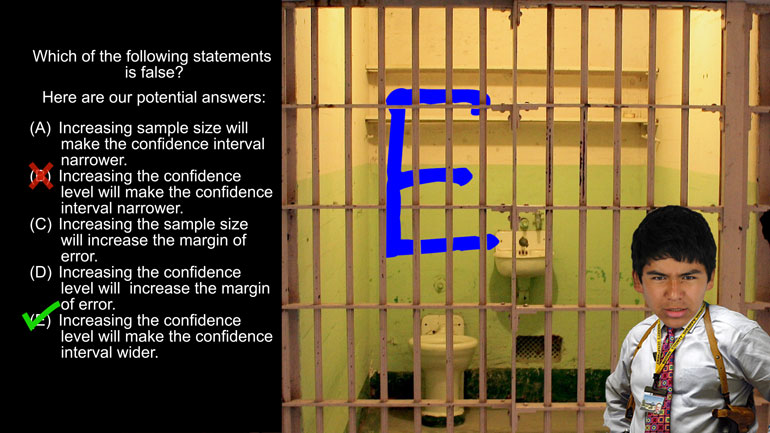
AP Statistics 1.5 Statistical Inference. Which of the following statements is false?
Want to pull an Oliver Twist and ask us for more? We've gotcha covered. Head over to /video/subjects/math/test-prep/ap-statistics/ for more AP...
