ShmoopTube
Where Monty Python meets your 10th grade teacher.
Search Thousands of Shmoop Videos
Statistics, Data, and Probability I Videos 30 videos
Statistics, Data, and Probability I: Drill Set 1, Problem 1. What is the mean yearly salary?
Statistics, Data, and Probability I: Drill Set 1, Problem 2. What is the median length of these writing utensils?
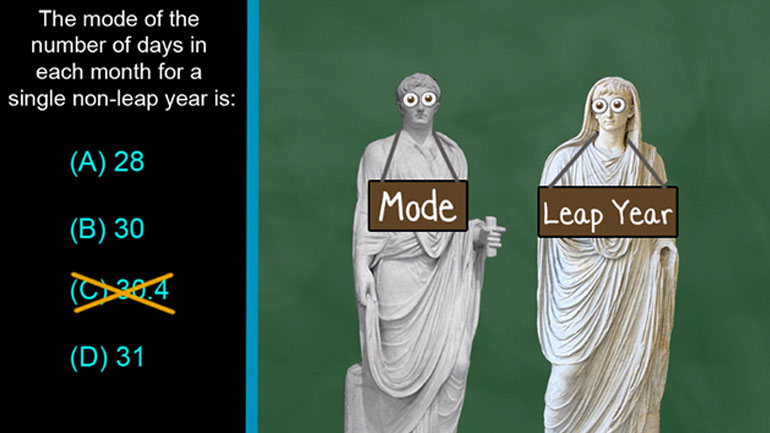
CAHSEE Math Statistics, Data, and Probability I: Drill Set 1, Problem 3. The mode of the number of days in each month for a single non-leap year is...
CAHSEE Math 2.4 Statistics, Data, and Probability I 183 Views
Share It!
Description:
Statistics, Data, and Probability I: Drill Set 2, Problem 4. Which of the following statements is true?
Transcript
- 00:03
Here's a boring, unshmoopy question you'll find on the exam...
- 00:07
Students in an Algebra 1 class took the following amount of time to finish a test.
- 00:12
Yep, another "can you read a chart" question. Check this out:
- 00:16
So the question asks... which of the following statements is true?
- 00:19
And here they are:
Full Transcript
- 00:27
So... when a question asks us anything like "which of the following are true",
- 00:31
it means we just have to roll up our sleeves and go one by one testing each little morsel
- 00:36
of hot dog they give us to evaluate. Let's just start with A.
- 00:39
It says, "more than half the students took between 15 and 45 minutes"
- 00:45
So then we just go back to the pie chart thing and see what it has to say.
- 00:49
Everything here is in percents, so to make things easier on ourselves, we can just think
- 00:53
about it as a number of students rather than some fancy fraction.
- 00:57
And in this case we can throw out answer A immediately because
- 01:00
57% took 45 minutes to an hour...
- 01:04
...that is, since over half DIDN'T fit in the 15 to 45 minute time window,
- 01:09
there's no way that more than half COULD.
- 01:12
We don't get brownie points for calculating that 10% took 15-30 minutes
- 01:16
and 23% took 30-45 minutes for a total of 33%.
- 01:22
So let's throw out A and move on as fast as we can.
- 01:25
B is sorta the counter-side of A.
- 01:28
It says LESS than half the students took 45 minutes to an hour to fnish...
- 01:33
...but we just noted that this number was 57% ... already OVER half.
- 01:38
So B is a quick easy toss out.
- 01:40
Move on to C.
- 01:41
C says: More than a quarter of the class took
- 01:43
EITHER 15 to 30 minutes to finish, OR did not finish the test at all.
- 01:49
So here, we've got a SUM. Meaning... we ADD both cases.
- 01:53
That's what happens when we have a conditional phrase like "OR".
- 01:57
As in... Hand me a condiment --
- 01:59
either that half gallon jug of ketchup OR that gallon jug of mustard.
- 02:04
So in the 15-30 minute group, we see that 10% of the students were captured here --
- 02:09
and then in the Did Not Finish group, we have 10% as well.
- 02:12
If we add them, we have a total of 20% of the students in those two groups.
- 02:17
So C is in fact only 20%, which is LESS than a quarter or 25%.
- 02:22
So C ain't cuttin' it for us either. Odds are very good D is the answer.
- 02:27
D says that more than a quarter of the class took between 15 and 45 minutes to finish.
- 02:33
Well, the 15-30 group was 10% - check.
- 02:36
And the 30-45 group was 23% - check.
- 02:40
ADD the two groups to get 33% and yeah -- woo hoo --
- 02:44
33% is in fact greater than a quarter or 25%
- 02:49
So the answer is, yes... we can read a pie chart. D.
- 02:53
Time for a slice.
Related Videos
CAHSEE Math: Algebra and Functions Drill 5, Problem 3. Solve the equation.
Statistics, Data, and Probability I: Drill Set 3, Problem 4. How many different avatars can be created based on the given options?
Statistics, Data, and Probability II Drill 3 Problem 2. Which two sports together make up for the preferences of more than half of all those w...
Statistics, Data, and Probability II Drill 3 Problem 3. One hundred twenty of those who were asked preferred what sport?
