ShmoopTube
Where Monty Python meets your 10th grade teacher.
Search Thousands of Shmoop Videos
Playlist CAHSEE Math Test Prep: Statistics, Data, and Probability II 30 videos
Statistics, Data, and Probability II Drill 3 Problem 2. Which two sports together make up for the preferences of more than half of all those w...
Statistics, Data, and Probability II Drill 3 Problem 3. One hundred twenty of those who were asked preferred what sport?
CAHSEE Math Statistics, Data, and Probability II: Drill 1 Problem 1. Which of the following tables best represents the relationship between the val...
CAHSEE Math 5.5 Statistics, Data, and Probability II 192 Views
Share It!
Description:
Statistics, Data, and Probability II Drill 5, Problem 5. If Bert purchased $15,000 in merchandise at wholesale prices, how much would he need to make in total sales to earn a 12% profit?
Transcript
- 00:03
Here’s a question to put a little shmoop in your step…
- 00:06
For the past few years, the owners of a local baseball team, the Fighting Pansies, have
- 00:10
been trying to increase slumping attendance by lowering ticket prices.
- 00:14
Twitter feedback indicates that the biggest barrier to ticket sales is the high cost of the ticket.
- 00:20
No one wants to pay through the roof to watch a bunch of Pansies play baseball.
Full Transcript
- 00:24
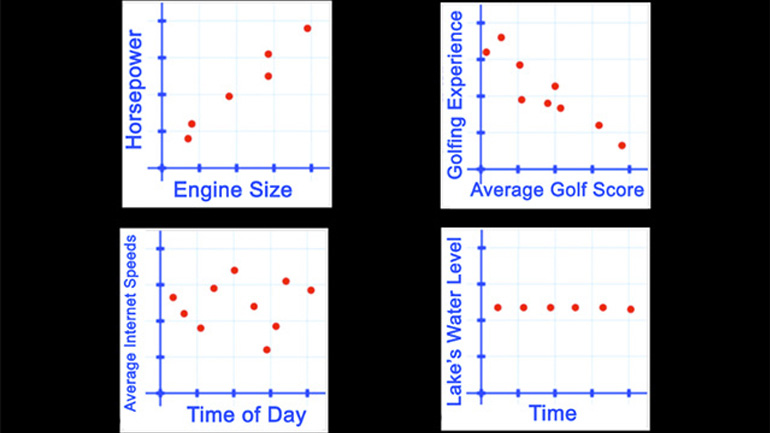
If a scatter plot were used here, horizontal values on it could represent the ever-higher
- 00:29
markdowns in ticket prices each year with respect to the original prices.
- 00:35
On the other hand, vertical values could represent the percentage increase in average attendance
- 00:40
per game starting from the beginning of the ticket price reductions.
- 00:44
Based on the above description, which of the following would be the most accurate statement
- 00:49
about the scatter plot representing this situation?
- 00:52
And here are the potential answers...
- 00:57
OK, so this long, hairy question is asking us to interpret a scatter plot… without providing us a scatter plot.
- 01:04
In other words… if WE were in charge of converting the given information into a scatter
- 01:08
plot… how on Earth would we do it?
- 01:10
Well, the problem tells us we should show
- 01:12
the discounted ticket prices along the horizontal, or x-axis…
- 01:17
…and the vertical, or y-axis, should show the percentage of increase in attendance.
- 01:22
If we were to put together such a plot, like this…
- 01:24
...with attendance going up as discounts go up…
- 01:27
…we’d have a POSITIVE correlation, since our plotted points move in an upward direction
- 01:31
from left to right.
- 01:33
Be careful here…
- 01:34
…if we were to compare attendance with ticket PRICES, we’d have a negative correlation…
- 01:38
…but because we’re asked to put the DISCOUNTS along the x-axis,
- 01:42
we actually do wind up with a positive correlation.
- 01:47
So our answer is A.
- 01:49
As in, “All-star.”
Related Videos
CAHSEE Math: Algebra and Functions Drill 5, Problem 3. Solve the equation.
Statistics, Data, and Probability I: Drill Set 3, Problem 4. How many different avatars can be created based on the given options?
Statistics, Data, and Probability II Drill 3 Problem 2. Which two sports together make up for the preferences of more than half of all those w...
Statistics, Data, and Probability II Drill 3 Problem 3. One hundred twenty of those who were asked preferred what sport?


