ShmoopTube
Where Monty Python meets your 10th grade teacher.
Search Thousands of Shmoop Videos
Algebra I Videos 81 videos
We don't like knocking people down to size, but we do like simplifying radicals. Join us?
Mathematical Reasoning Drill 4 Problem 1. Approximately how many gallons of paint is needed if eight people paint the wall together for an hour?
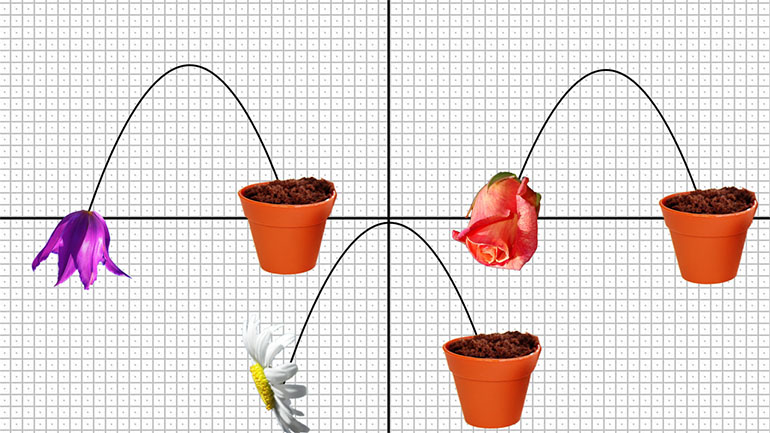
GED Math 1.1 Graphs and Functions. Which is the appropriate region of the coordinate plane?
Data Interpretation 1205 Views
Share It!
Description:
Data doesn't do us much good if we can't interpret it. Ever snuck into a CPA's office while he slips out for a coffee break and tried to decipher one of the spreadsheets on his PC? No? Uh... yeah, right, us neither.
- Mathematics and Statistics Assessment / Interpreting Categorical and Quantitive Data
- Statistics and Probability / Summarize, represent, and interpret data on a single variable
- Statistics and Probability / Summarize, represent, and interpret data on a single variable
- Statistics and Probability / Understand and evaluate random processes underlying statistical experiments
- Statistics and Probability / Make inferences and justify conclusions from sample surveys, experiments, and observational studies
- Statistics and Probability / Summarize, represent, and interpret data on a single variable
- Statistics and Probability / Summarize, represent, and interpret data on a single variable
- Statistics and Probability / Understand and evaluate random processes underlying statistical experiments
- Statistics and Probability / Make inferences and justify conclusions
Transcript
- 00:05
Data interpretation, a la Shmoop. You and your best friend do everything together.
- 00:12
Let's face it, you two are pretty much attached at the hip.
- 00:15
It's becoming complicated though, because you're starting to get a little better at
- 00:18
things than your BFF. You won the cookie eating contest.
- 00:23
You beat them in the potato sack race. You were able to swim all the way across the
Full Transcript
- 00:28
lake. You can feel things coming to a head.
- 00:33
So how can you two still be friends if you are so much better at everything than they
- 00:37
are? The answer? Data Interpretation!
- 00:40
In the world of Pre-Algebra -- and in many other mathematical worlds as well...
- 00:45
...data interpretation is the expression and analysis of data that you've collected.
- 00:50
A couple common tools used to interpret information and express data are Bar Graphs and Pie Charts.
- 00:57
No, no, no -- this kind of bar and this kind of pie.
- 01:01
Let's revisit the infamous cookie eating contest of last December...
- 01:05
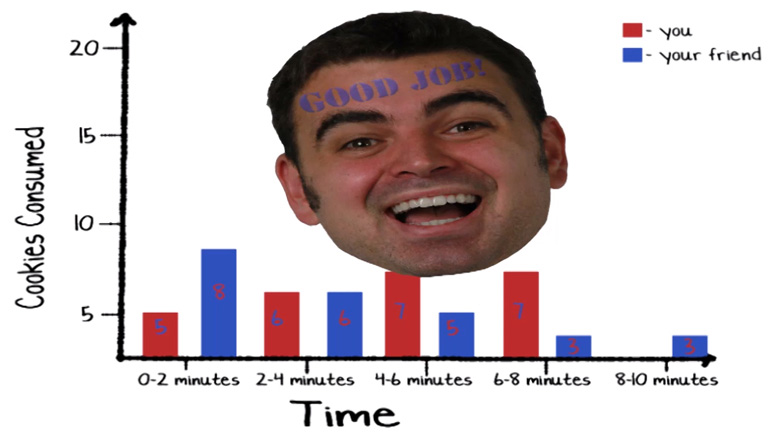
...and make a bar graph of the results over the course of time.
- 01:08
As you'll recall, the goal was to eat 25 Chips Ahoy cookies as quickly as possible.
- 01:13
So yeah -- you won. But let's interpret this data with a bar graph
- 01:17
for you, and one for your friend... ...to see how we might be able to give your
- 01:21
friend some cookie-eating cred. Let's break the bars into chunks of time.
- 01:25
The first bar will be cookies consumed from start to minute two.
- 01:29
The second bar will be cookies consumed from minute two to minute four...
- 01:33
... and so on and so forth. Let's look at the two graphs side by side.
- 01:38
Is there any way we can make your friend the hero in this case?
- 01:42
As it turns out, your friend is actually a sprinter in the cookie consuming department.
- 01:45
He ate 8 cookies in the first two minutes while you only ate 5.
- 01:49
Of course you did come back for the win. But we definitely think his speedy consumption
- 01:54
is deserving of a shout-out. So... if you feel like you are always winning
- 01:58
- or always losing, for that matter... ...remember - there are different ways to
- 02:02
interpret the data from any particular event. And sometimes the interpretation may turn
- 02:07
you from a loser... into a wiener.
Related Videos
Statistics, Data, and Probability I: Drill Set 3, Problem 4. How many different avatars can be created based on the given options?
Statistics, Data, and Probability II Drill 3 Problem 2. Which two sports together make up for the preferences of more than half of all those w...
Statistics, Data, and Probability II Drill 3 Problem 3. One hundred twenty of those who were asked preferred what sport?
If you're looking for tips on how to score more free samples at Yogurtland, you've got the wrong video.


