ShmoopTube
Where Monty Python meets your 10th grade teacher.
Search Thousands of Shmoop Videos
AP Calculus Videos 14 videos
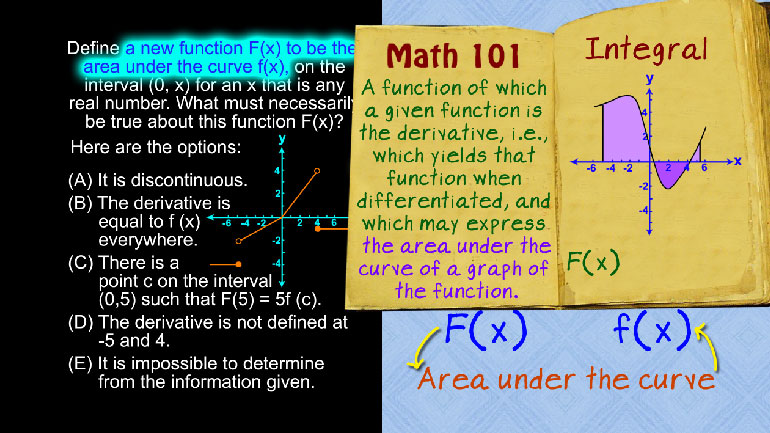
AP Calculus: Integrals Drill 1, Problem 1. What must necessarily be true about this function F(x)?
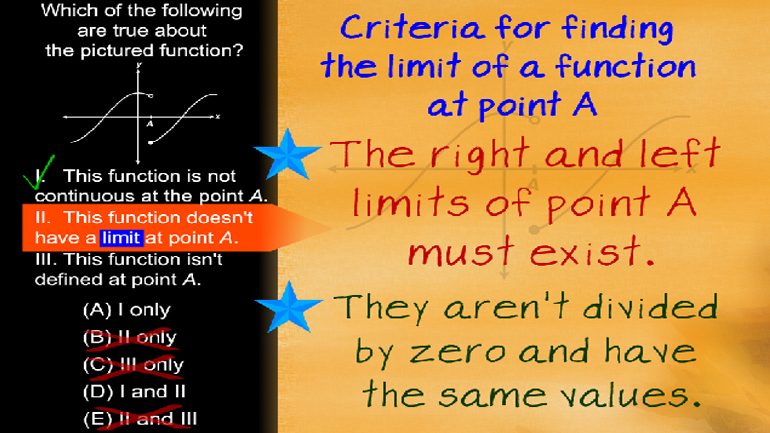
AP Calculus: Problem Explanation Limits Drill 1, Problem 1. Which of the following are true about the pictured function?
Introduction to Integrals with Riemann Sums 620 Views
Share It!
Description:
Riemann sums are a way to estimate the area under a curve. Check out the video for all the deets.
- MPAC 1 / Reasoning with definitions and theorems
- MPAC 2 / Connecting concepts
- MPAC 4 / Connecting multiple representations
- MPAC 5 / Building notational fluency
- MPAC 6 / Communicating
- MPAC 1 / Reasoning with definitions and theorems
- MPAC 2 / Connecting concepts
- MPAC 4 / Connecting multiple representations
- MPAC 5 / Building notational fluency
- MPAC 6 / Communicating
Transcript
- 00:05
Introduction to Integrals with Riemann Sums, a la Shmoop.
- 00:09
Tickets to see the Sun Bear and Angora Rabbit are selling out fast.
- 00:12
They don't do any tricks or anything. They're just hilarious to look at.
- 00:18
The ticket machine comes with a real-time ticket tracker that graphs the number of tickets
- 00:23
sold per hour throughout the day.
Full Transcript
- 00:25
At the end of the day, Mr. Robin... the Sun Bear and Angora Rabbit's best friend....
- 00:29
...wants to see how popular his friends were by calculating the total number of tickets
- 00:34
sold over 10 hours.
- 00:36
How can we solve for the total number of tickets sold?
- 00:39
Well, let's first take a look at this graph.
- 00:41
It's important to notice that our function is non-negative, which means the function
- 00:46
never outputs a negative y-value.
- 00:49
The y-axis shows the number of tickets sold per hour and the x-axis shows how much time
- 00:55
has passed since opening.
- 00:57
If we multiply y, the tickets sold over time, by x, or time, hours cancel out, so we get
- 01:03
the number of tickets sold at every interval.
- 01:05
This is the same as multiplying the y-value of a point on the curve by the relevant interval
- 01:11
on the x-axis.
- 01:13
If we add up all the intervals, we get the area under the curve.
- 01:15
So, to figure out how many tickets were sold in total, we just need to find the area under
- 01:20
the curve from x = 0 to x = 10.
- 01:23
Unfortunately, the curve is an irregular shape, which means we don't have a formula we can
- 01:29
use to find the exact area. What we can do instead is approximate the
- 01:34
area by drawing a series of rectangles that more or less cover the curve...
- 01:38
...and use the total areas of those rectangles as an estimate of the area under the curve.
- 01:43
There are several different ways we can draw these rectangles, but the most common way
- 01:47
is to put the top left corner of each rectangle directly on the curve.
- 01:53
This will produce a series of rectangles with equal width but varying height based on the
- 01:59
curve, and is called the Left-Hand Sum. For now, we can partition, or slice, the curve
- 02:05
into sub-intervals every two hours, giving us a total of five slices.
- 02:10
As you can see, some of the rectangles drawn underestimate and overestimate the area of
- 02:15
the curve... ...but they basically cancel each other out,
- 02:18
so it gives us a pretty good estimation of the area under the curve.
- 02:23
When finding a left-hand sum, we need to know the value of the function at the left endpoint
- 02:28
of each sub-interval.
- 02:30
Let's look at the first sub-interval between hours 0 and 2 and calculate the area of the
- 02:36
rectangle.
- 02:37
We can see that the left endpoint of the sub-interval is 10.
- 02:41
We know from the good ol' Pre-Algebra days that the area of a rectangle is base times
- 02:46
height.
- 02:46
So we can calculate the area of a rectangle at the first sub-interval by multiplying the
- 02:52
base, or 2, by the height, ten...
- 02:54
...to get 20 as the area of the rectangle. For the second interval, the height is 12,
- 03:01
so the area of the rectangle is two times 12, or 24.
- 03:05
For the third interval, the height is 17, so the area is two times 17, or 34.
- 03:10
The fourth interval has height 23, so the area is two times 23, or 46.
- 03:14
The last interval has height 22, so the area is 2 times 22, or 44.
- 03:21
Adding these up, we find that the total area is approximately 20 plus 24 plus 34 plus 46
- 03:27
plus 44, or 168.
- 03:31
But for people like Mr. Robin, an approximation isn't good enough.
- 03:35
Even if the overestimations and underestimations roughly cancel each other out, the approximation
- 03:40
still isn't exact.
- 03:41
But the more sub-intervals we have, the more accurate our approximation would be.
- 03:48
Suppose we wanted to generalize the width of our subintervals with a formula.
- 03:56
We can label our width with delta x. Since we're dividing the interval... a, b...into...n...equal
- 04:04
sub-intervals, each sub-interval will have length: b minus a over n.
- 04:09
So delta x equals b minus a over n.
- 04:12
The area of a rectangle is length times width.
- 04:15
The length of every rectangle is the height of the curve at each left endpoint...
- 04:19
...so the area can be written as f of x, the length, times delta x, the width.
- 04:26
To find the total area, we can just find the sum of the areas of all the rectangles.
- 04:31
Another way to write this is in sigma notation.
- 04:34
Notice that we are finding the summation of the area of each rectangle, represented by
- 04:38
the formula we calculated earlier.
- 04:41
This form is called a Riemann sum.
- 04:44
Remember how we said that the approximation got more precise with more subintervals?
- 04:50
Let's take this to the extreme and see if we can go from more and more intervals to
- 04:55
an infinite number of intervals. We can take the limit of our Riemann sum as
- 04:59
n approaches infinity, giving us an infinite number of slices.
- 05:04
This will give us an exact approximation of the area under the curve.
- 05:14
Taking this limit as n approaches infinity, gives us a total area of 168.53É
- 05:19
...which is SUPER close if you compare it to the approximation found with rectangles.
- 05:26
Looks like Mr. Robin's friends are pretty popular...with 168 total tickets sold!
- 05:30
Impressive... especially considering that huge Ticketmaster markup.
Related Videos
Who wants to be a millionaire? In this video, learn about compound interest, interest rates, and the compound interest formula. You'll be buying th...
ACT Math: Pre-Algebra Drill 5, Problem 2. If a and b are prime numbers, how many factors does ab have?
We don't like knocking people down to size, but we do like simplifying radicals. Join us?
If fleeing criminals always fled the scene of the crime at perfect right angles, it would be much easier to determine their whereabouts. Fortunatel...

