ShmoopTube
Where Monty Python meets your 10th grade teacher.
Search Thousands of Shmoop Videos
Evaluating Data Videos 6 videos
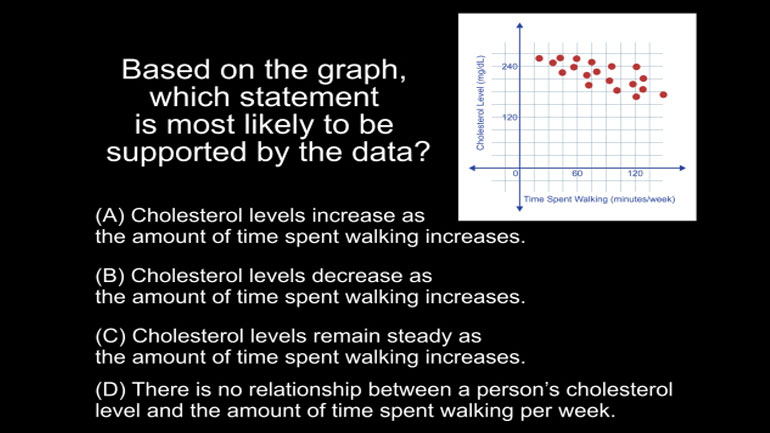
Statistics, Data, and Probability II Drill 4 Problem 2. Based on the graph, which statement is most likely to be supported by the data?
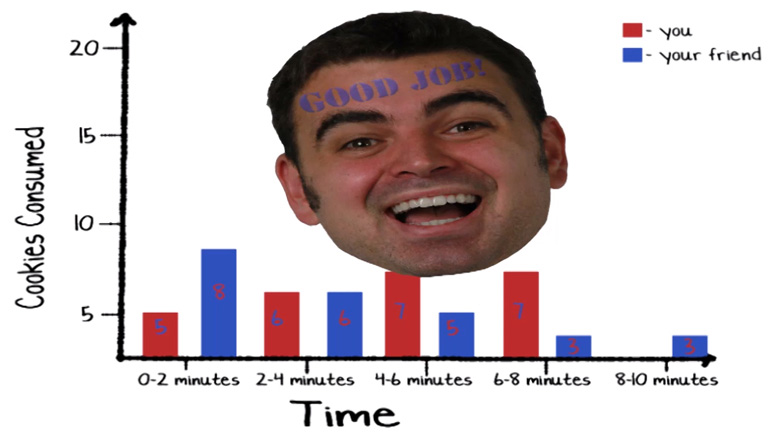
Statistics, Data, and Probability II Drill 6 Problem 4. What conclusion can be drawn from the graph?
People often tell us that we're more than three deviations away from normal. According to the curve, that means we're cooler than 98% of the popula...
SAT Math 1.1 Statistics and Probability 289 Views
Share It!
Description:
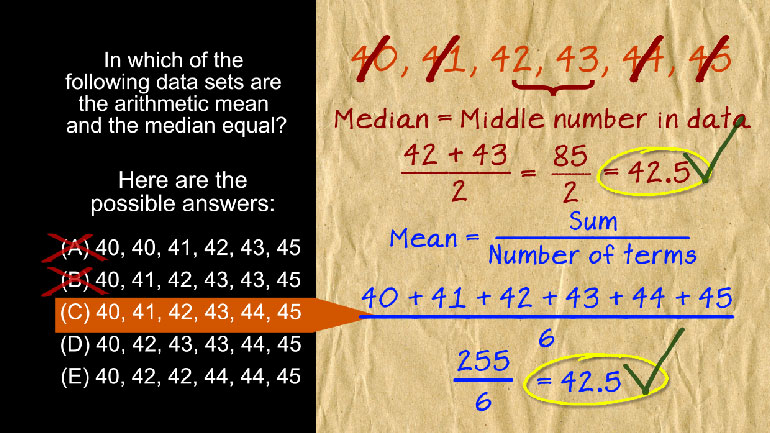
SAT Math 1.1 Statistics and Probability. In which of the following data sets are the arithmetic mean and the median equal?
- Statistics / Median
- Product Type / SAT Math
- Mathematics and Statistics Assessment / Probablistic Reasoning
- Statistics and Probability / Summarize, represent, and interpret data on a single variable
- Statistics and Probability / Summarize, represent, and interpret data on a single variable
- Statistics and Probability / Summarize, represent, and interpret data on a single variable
- Statistics and Probability / Summarize, represent, and interpret data on a single variable
- Problem Solving and Data Analysis / Data collection and evaluation
Transcript
- 00:02
You can't handle the Shmoop!
- 00:06
In which of the following data sets are the arithmetic mean and the median equal?
- 00:11
And here are the potential answers…
- 00:15
To solve this problem, we just have to compare the mean and median
- 00:18
in each of the answer choices, until we find a match.
Full Transcript
- 00:22
Remember that we can find the arithmetic mean, a fancy term for average, by adding up all
- 00:27
of the values, and dividing by the total number of values we've added.
- 00:32
The median is simply the value in the middle of all of the data.
- 00:37
In the answer choices given, there are 6 values, so there’s no one single value in the middle.
- 00:42
When this happens, we take the midpoint of the two middle values.
- 00:46
Let's start looking at our answers. In data set A, we have 40, 40, 41, 42, 43, and 45.
- 00:53
To find the median, we cross out the min and the max values.
- 00:56
Then we do it again. We’re left with two values, so the mean of the two is the median.
- 01:01
Between 41 and 42 is 41.5.
- 01:04
Now for the mean. We add up all of the values, and get 251. Then, we divide by 6 to get 41.833.
- 01:12
The mean is 41.83, and the median is 41.5. They’re not the same.
- 01:18
So we can cross off answer choice A. Our next set is 40, 41, 42, 43, 43, 45.
- 01:25
Applying the same method to find the median, we get 42.5.
- 01:29
When we find the mean, we add up our numbers to get 254, and divide by 6 to get 42.3.
- 01:35
Still not the same. Onto C, which is 40, 41, 42, 43, 44, 45.
- 01:40
The median is 42.5.
- 01:42
When we add up all of the values, we get 255. When we divide by 6, we get 42.5.
- 01:49
The mean and median of C is the same. We’ve found our answer.
Related Videos
SAT Math 2.1 Geometry and Measurement. What is the measure of angle z in terms of x and y?
In 2014, the unemployment rate of one county in California was 7%. In another county, the unemployment rate was 11%. Which of the following express...
Angela is making cookies for a bake sale. She expects each batch of her cookies to sell for $40. It costs her $10 to make one batch of cookies, and...
