ShmoopTube
Where Monty Python meets your 10th grade teacher.
Search Thousands of Shmoop Videos
ACT Science Videos 67 videos
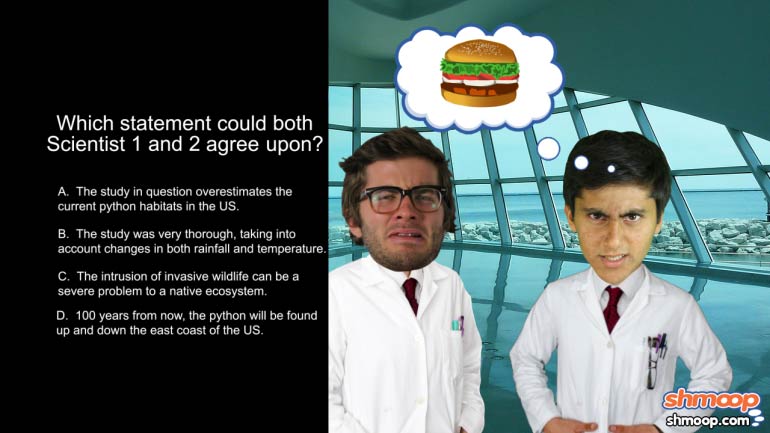
ACT Science: Conflicting Viewpoint Passage Drill 1, Problem 1. What statement would both scientists agree upon?
ACT Science: Data Representation Passage Drill 1, Problem 1. What do the statistics in Figure 1 suggest?
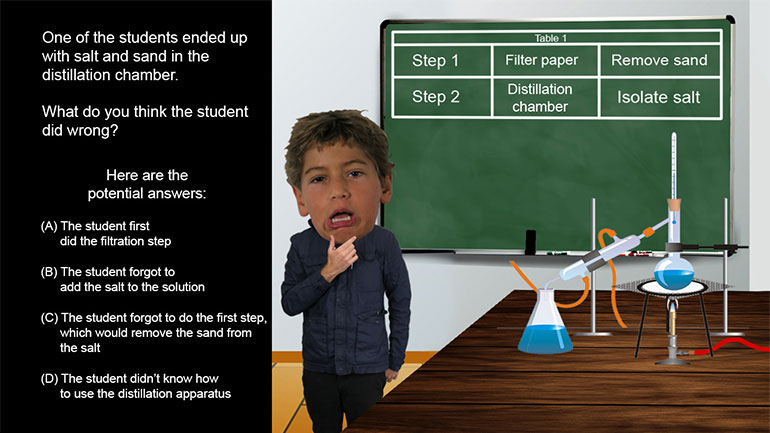
ACT Science: Research Summary Passage Drill 1, Problem 1. What is the method used by the scientists in this experiment?
ACT Science 1.9 Data Representation Passage 203 Views
Share It!
Description:
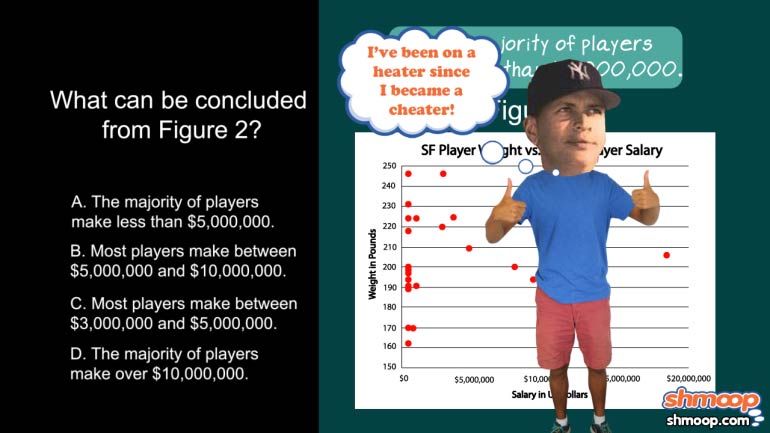
ACT Science: Data Representation Passage Drill 1, Problem 9. Which of the following ideas can be supported by Figure 2?
Transcript
- 00:04
Here's your shmoop du jour: brought to you by crying.... there's none of that in baseball.
- 00:09
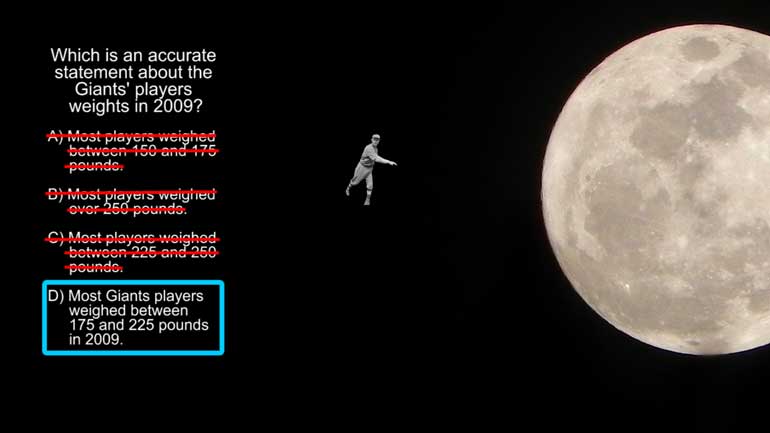
Which of the following ideas can be supported by Figure 2?
- 00:12
And here are the potential answers...
- 00:20
This question is asking us about Figure 2 again. And just Figure 2, so we can ignore Figure 1.
- 00:26
Choice A. More than half make less than 1 million.
Full Transcript
- 00:30
Well..it looks like a pretty big majority of the red circles are pretty close
- 00:33
to the $0 mark on the x-axis. So we can conclude that this statement is true.
- 00:38
Just to check the other answers to be extra sure.
- 00:42
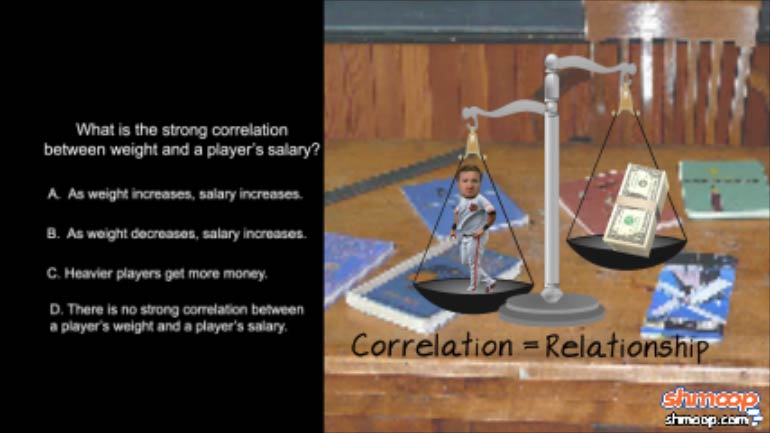
Weight is an important indicator of how much a player will make. Well, looking at the wide
- 00:46
range of weights that make less than $1 million-this statement probably isn't true.
- 00:53
Statement C. Heavier players receive more salary. Again, like statement b, not true.
- 00:59
Finally, statement D, most players weight over 300 pounds. Well given that our graph's
- 01:04
y-axis doesn't even go above 250 pounds, this statement is definitely false too.
- 01:09
Our answer's A!
Related Videos
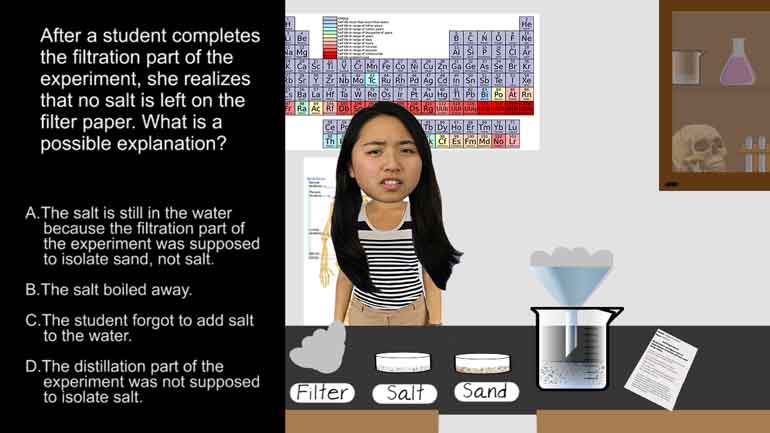
ACT Science: Research Summary Passage Drill 2, Problem 1. Why do you think that the filter paper will not remove the salt from the water?
ACT Science: Conflicting Viewpoint Passage Drill 1, Problem 1. What statement would both scientists agree upon?
ACT Science: Data Representation Passage Drill 1, Problem 1. What do the statistics in Figure 1 suggest?
ACT Science: Data Representation Passage Drill 1, Problem 2. Which of the following is a variable in Figure 1, but not in Figure 2?
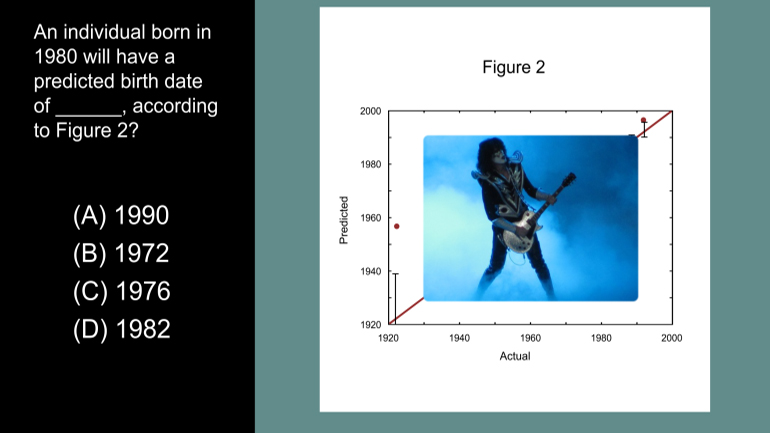
ACT Science Data Representation Passage: Drill 3, Problem 5. According to Figure 2, what birth date will be predicted for an individual actual...
