ShmoopTube
Where Monty Python meets your 10th grade teacher.
Search Thousands of Shmoop Videos
Exploring Data Videos 25 videos
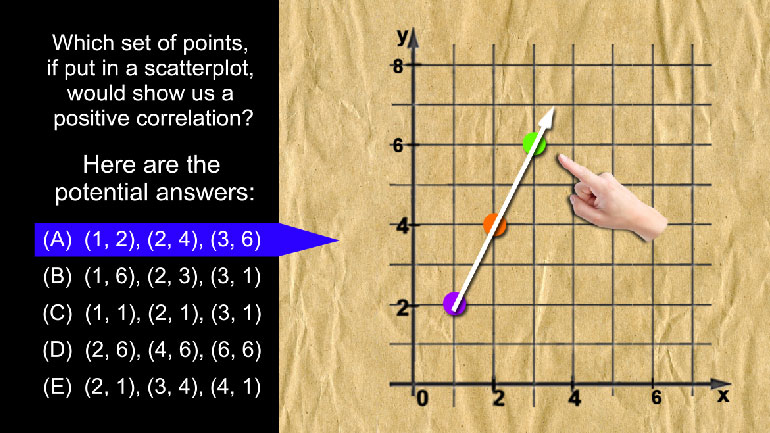
AP Statistics: Exploring Data Drill 2, Problem 3. Which set of points, if put in a scatterplot, would show us a positive correlation?
AP Statistics: Exploring Data Drill 1, Problem 2. Which of the following is the best way to display this type of data?
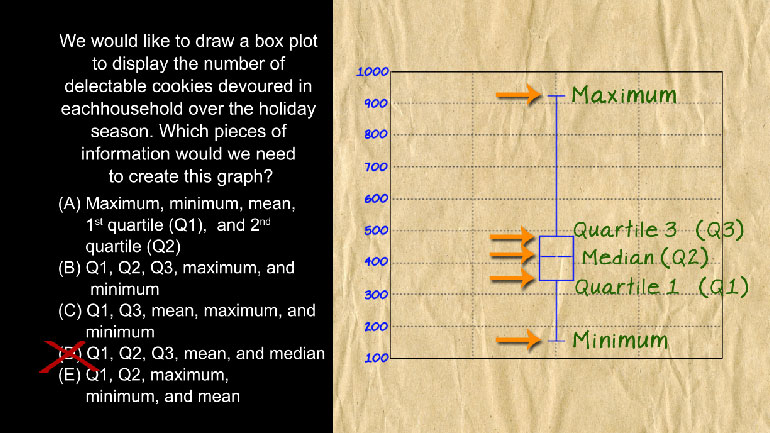
AP Statistics: Exploring Data Drill 1, Problem 5. Which pieces of information would we need to create this graph?
AP Statistics 4.4 Exploring Data 12 Views
Share It!
Description:
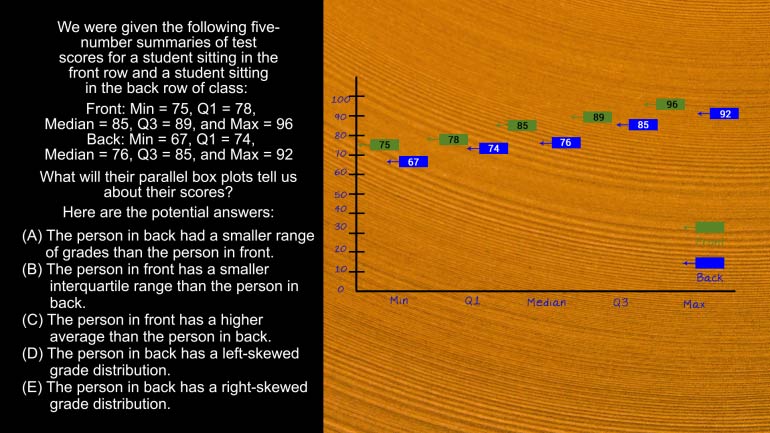
AP Statistics 4.4 Exploring Data. Box plots do not allow us to compare...what?
Transcript
- 00:04
And here's your shmoop du jour brought you by basketball
- 00:06
players so this thing should be a slam dunk compare the shoe sizes as members [basketball player performs a slam dunk]
- 00:10
of the girls basketball and boys basketball teams we created two box plots
- 00:14
however box plots do not allow us to compare what? And here's the potential
- 00:20
answers... All right so to answer this question we have to do a little boxing [Young boys boxing]
Full Transcript
- 00:25
well a little box plotting anyway, this one's less likely to result in a
- 00:30
broken nose so that's good and we want to compare shoe sizes here boys versus [boys team and girls team huddled together]
- 00:34
girls and we want to know what we will not be able to measure let's take these
- 00:38
one at a time can we measure A; spread, well sure a box plot is one of these
- 00:42
things they're pretty thorough like someone who does a really great job [Man flossing his teeth]
- 00:45
flossing and we've heard people like that exist. A box plot shows us just about
- 00:50
everything we can see the max and min values interquartile range an yeah, the
- 00:55
whole shebang so obviously if we can see all these different data points we can [finger points to a box plot example]
- 00:58
get a sense of the spread so adios option A. What about B; outliers? Yep, box
- 01:03
plots show us those as well usually indicated with asterisk nope box plots
- 01:08
may also use asterisk to make subtle catty remarks really you have an
- 01:12
attitude problem okay so it's not B will a box plot show us the medians sure
- 01:16
a median is the center most data point and that's shown right here and it can't [Median in a box plot highlighted purple]
- 01:20
be D either because skewness... an actual word we promise, is all about how
- 01:25
asymmetric our data points are all info we can pick up by looking at the box
- 01:30
plot this thing is a wealth of information there anything it can't tell [an information and help desk]
- 01:33
us. Better hope so or else we're going to have to select option F and give up.
- 01:38
Fortunately for us a box plot cannot tell us the means we've got a good sense
- 01:42
of the highs and lows and everything in between but because we don't have all [A box plot with a calculation missing several data]
- 01:45
the data we can't add everything up and divide to find the mean so we'll never
- 01:50
find out the average foot size of these Behemoths with just a box plot. [A shoe lands on a box plot]
- 01:56
All right option E is correct next we'd like to see a box plot of a Foxtrot, yep
- 02:00
probably won't be any different or more interesting [A frying pan sizzling on a hob]
- 02:04
Related Videos
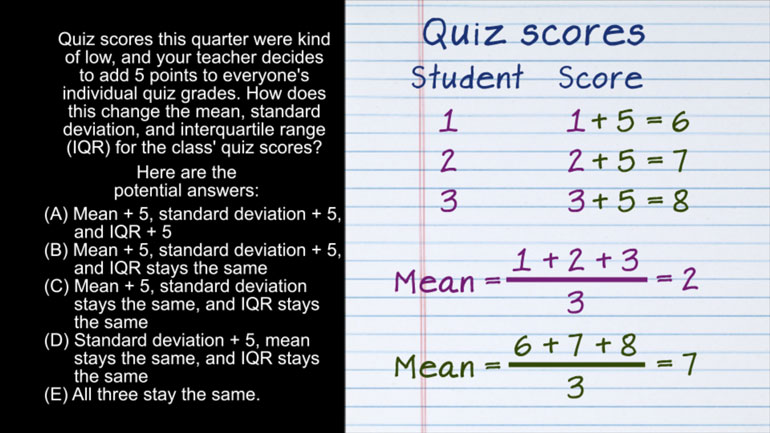
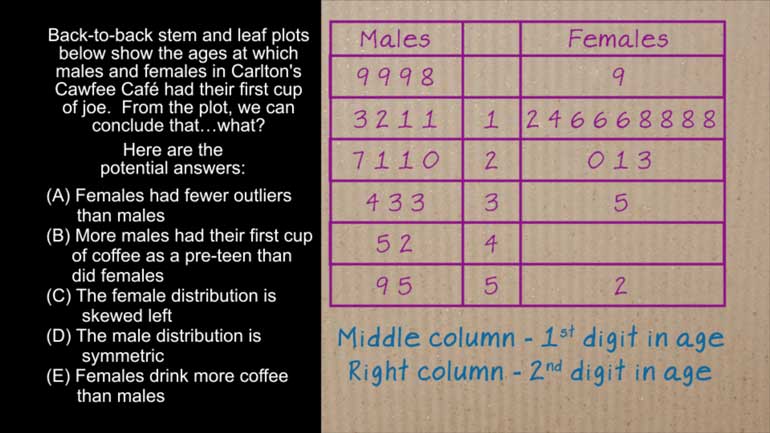
AP Statistics 2.1 Exploring Data. How does this change affect the mean, standard deviation, and IQR?
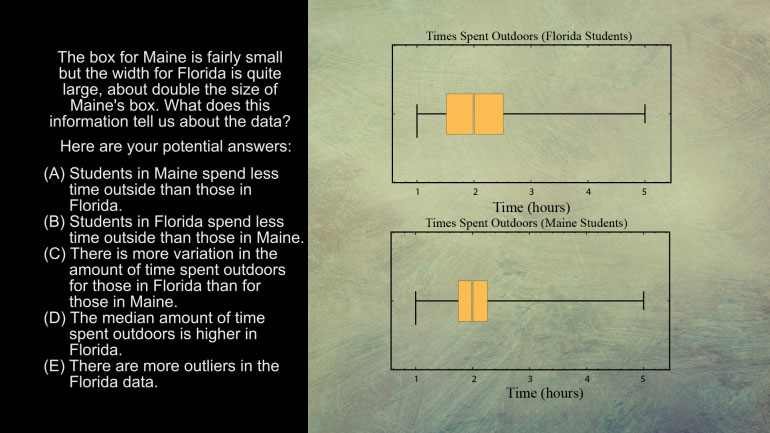
AP Statistics 5.1 Exploring Data. What does this information tell us about the data?
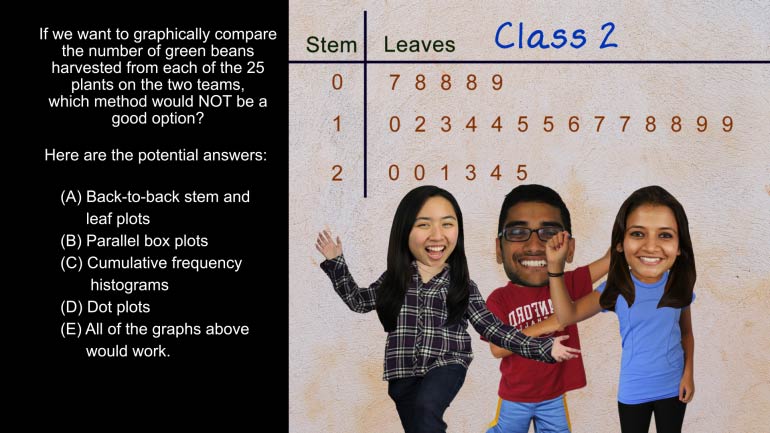
AP Statistics 5.2 Exploring Data. Which method would not be a good option?
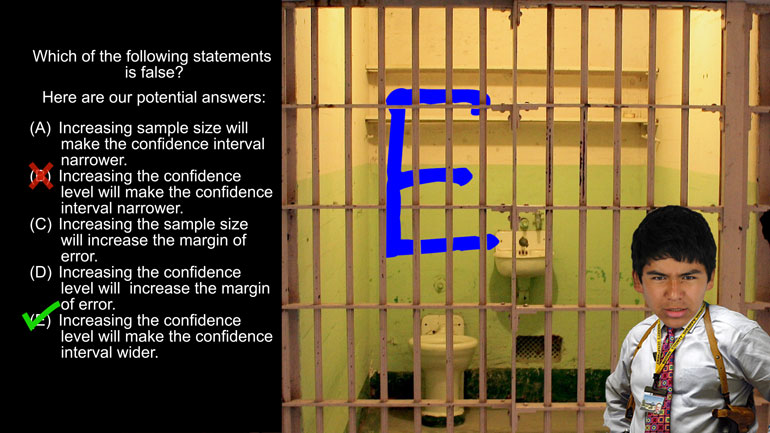
AP Statistics 1.5 Statistical Inference. Which of the following statements is false?
Want to pull an Oliver Twist and ask us for more? We've gotcha covered. Head over to /video/subjects/math/test-prep/ap-statistics/ for more AP...
