ShmoopTube
Where Monty Python meets your 10th grade teacher.
Search Thousands of Shmoop Videos
Exploring Data Videos 25 videos
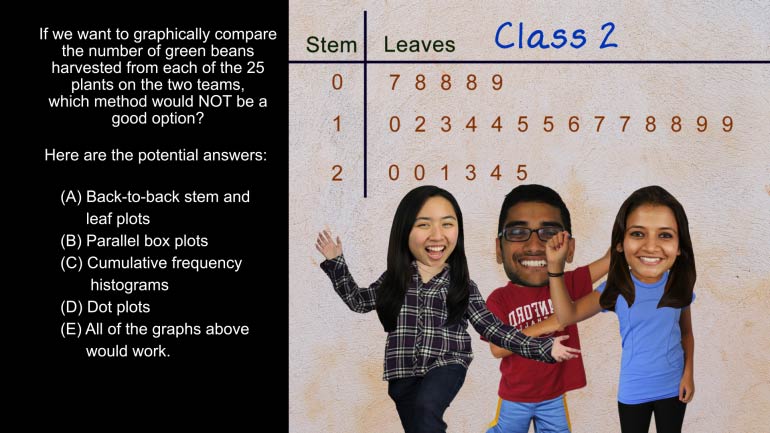
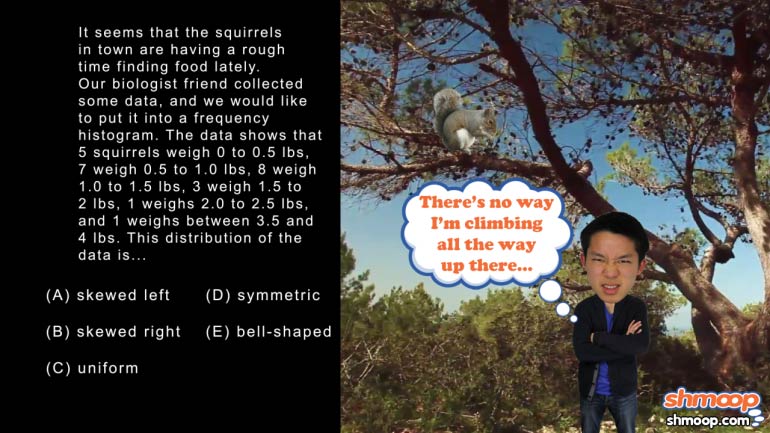
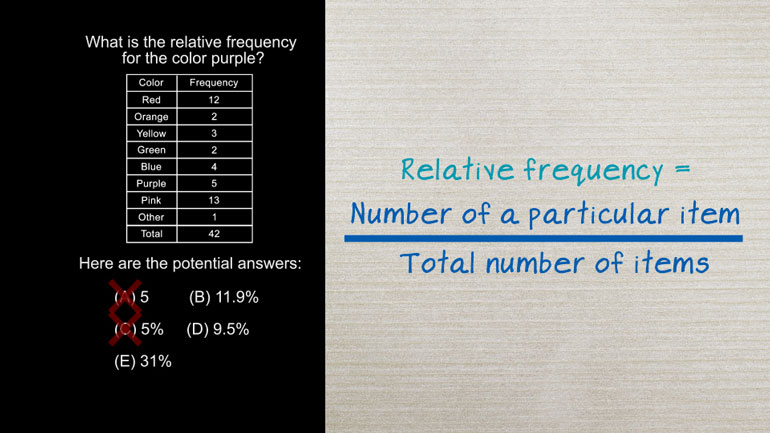
AP Statistics 5.2 Exploring Data. Which method would not be a good option?
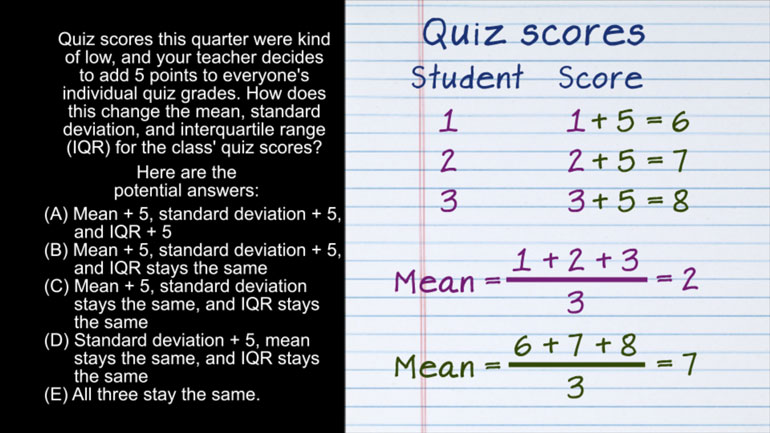
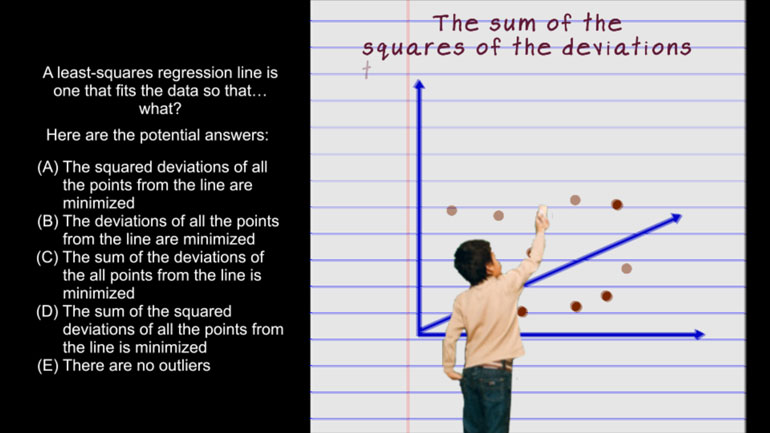
AP Statistics 2.1 Exploring Data. How does this change affect the mean, standard deviation, and IQR?
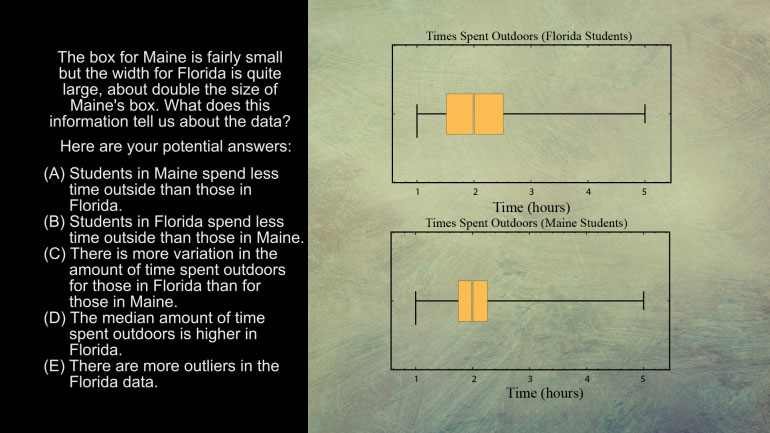
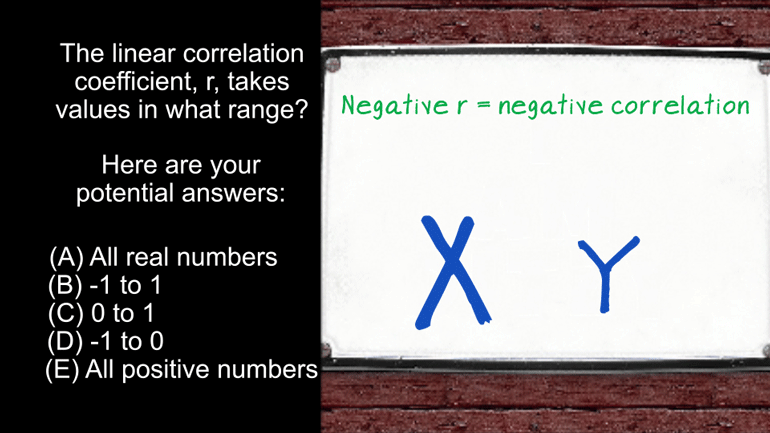
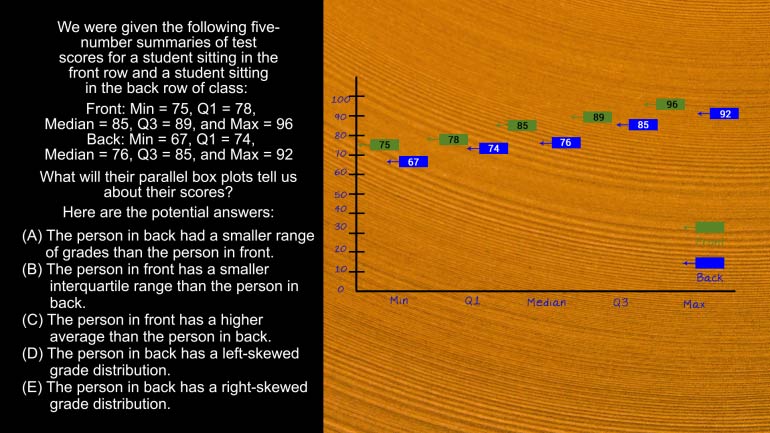
AP Statistics 5.1 Exploring Data. What does this information tell us about the data?
AP Statistics 5.4 Exploring Data 182 Views
Share It!
Description:
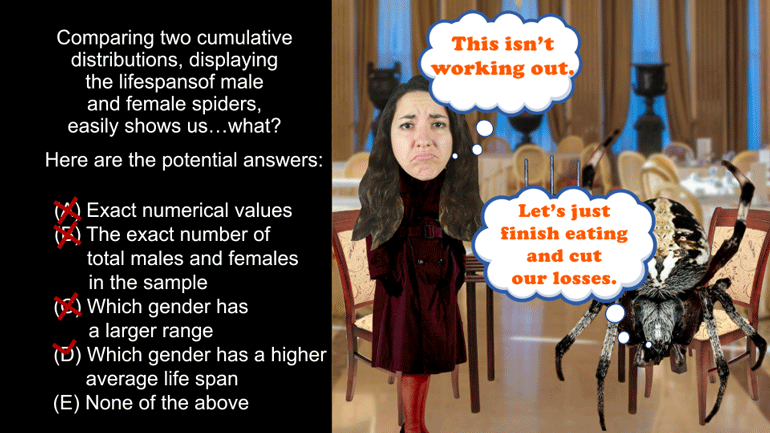
AP Statistics 5.4 Exploring Data. Comparing two cumulative distributions, displaying the lifespans of male and female spiders, easily shows us what?
More Video DetailsTranscript
- 00:00
Thank you We sneak and here's your shmoop du jour
- 00:05
brought to you by spiders also brought to you by
- 00:08
spiders anxiety disease venom and fear So yeah they're generous
- 00:14
preacher all right Comparing to cumulative distribution displaying the life
- 00:18
spans of male and female spiders easily shows us uh
Full Transcript
- 00:22
what And here the essential answers Jd of spiders all
- 00:28
right there's One thing more disgusting than spiders His test
- 00:30
questions that pretend to be on the up enough but
- 00:32
are actually being stealthily evil Well this is one of
- 00:35
those questions Why Because it's basically a trick question We
- 00:38
only need to know one thing about cumulative distribution and
- 00:42
that's that they don't provide any numerical values So you're
- 00:45
not going to find the number of spiders in the
- 00:47
sample You're not going to get a sense of the
- 00:49
range You won't learn diddly squat about their average life
- 00:52
Span's which is just dandy with us the less we
- 00:55
know about five better But you have The answer Here
- 00:57
is eat none of the above Oh a p test 00:00:59.979 --> [endTime] makers What tangled webs you weave
Related Videos
AP Statistics 2.1 Exploring Data. How does this change affect the mean, standard deviation, and IQR?
AP Statistics 5.1 Exploring Data. What does this information tell us about the data?
AP Statistics 5.2 Exploring Data. Which method would not be a good option?
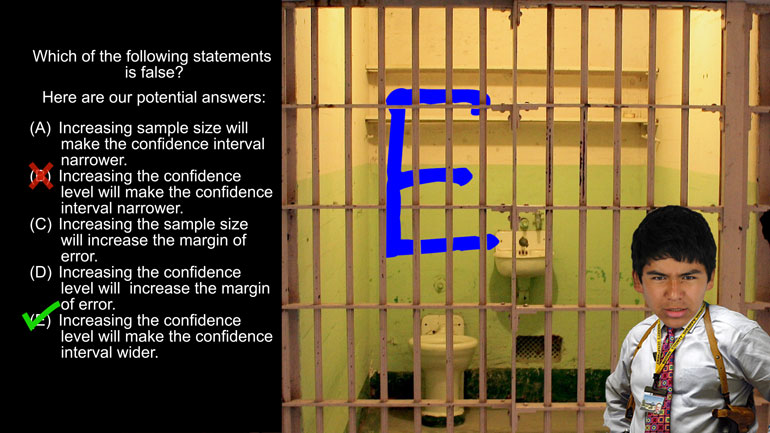
AP Statistics 1.5 Statistical Inference. Which of the following statements is false?
Want to pull an Oliver Twist and ask us for more? We've gotcha covered. Head over to /video/subjects/math/test-prep/ap-statistics/ for more AP...
