ShmoopTube
Where Monty Python meets your 10th grade teacher.
Search Thousands of Shmoop Videos
Charts, Graphs, and Tables Videos 60 videos
This video covers how to set up a stem and leaf plot and use it to find the mean and median of a set of numbers.
Knock-Knock. ¡Histograma cantante! Aquí para cantarte a tí acerca de toda la alegría y maravillas de lo que hacemos. ¿Te interesaría adquirir...
CAHSEE Math 6.2 Statistics, Data, and Probability II 171 Views
Share It!
Description:
Statistics, Data, and Probability II: Drill Set 6, Problem 2. Which of the following statements is the most accurate, based on the graph?
Transcript
- 00:03
Alright, let's put this question on your plate and eat it.
- 00:07
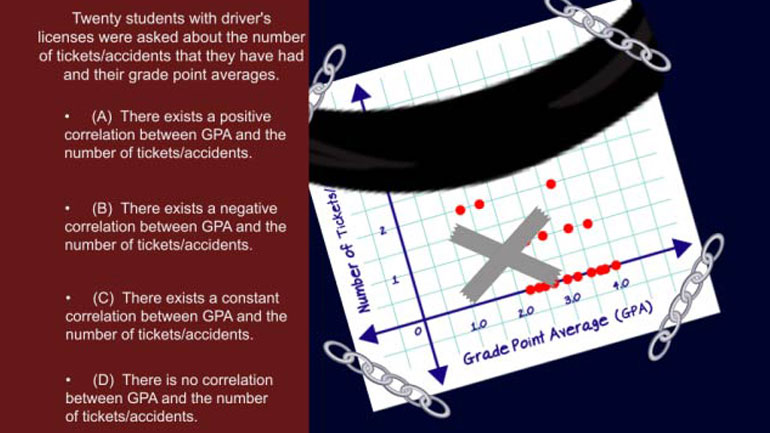
Twenty students who have driver's licenses were asked about the number of tickets and/or
- 00:10
accidents that they have had and their grade point averages.
- 00:14
The students without driver’s licenses were not polled, mainly because…
- 00:17
well, they shouldn’t be driving.
Full Transcript
- 00:19
The results of the survey is shown in the following graph.
- 00:23
Which of the following statements is the most accurate, based on the graph?
- 00:27
And here are the potential answers...
- 00:36
Wow, gnarly graph.
- 00:38
Really hard to figure out what it’s telling us, as there’s no clear pattern.
- 00:44
So let’s just go through one by one…
- 00:47
A. “There exists a positive correlation between GPA and the number of tickets/accidents.”
- 00:52
Hm… the smarter kids get more tickets?
- 01:01
Doesn’t make much sense… and it’s not supported by the graph.
- 01:04
The points would be going up and to the right if that were the case…moving on...
- 01:08
B. “There exists a negative correlation between GPA and the number of tickets/accidents.”
- 01:14
Would make more sense, but… same deal. Not a clear-cut pattern from the data here.
- 01:19
C. “There exists a constant correlation between GPA and the number of tickets/accidents.”
- 01:25
No – nothing is ‘constant’ about this graph.
- 01:27
Other than our constant confusion as to what it’s trying to say.
- 01:34
D. “There is no correlation between GPA and the number of tickets/accidents.”
- 01:39
Yeah – this has to be it... there’s really NO correlation between much of anything here.
- 01:43
As hard as we may try to find one. So our answer is D.
- 01:46
As in… “Dumb people aren’t necessarily the worst drivers.”
Related Videos
CAHSEE Math: Algebra and Functions Drill 5, Problem 3. Solve the equation.
Statistics, Data, and Probability I: Drill Set 3, Problem 4. How many different avatars can be created based on the given options?
Statistics, Data, and Probability II Drill 3 Problem 2. Which two sports together make up for the preferences of more than half of all those w...
Statistics, Data, and Probability II Drill 3 Problem 3. One hundred twenty of those who were asked preferred what sport?
