ShmoopTube
Where Monty Python meets your 10th grade teacher.
Search Thousands of Shmoop Videos
Charts, Graphs, and Tables Videos 60 videos
This video covers how to set up a stem and leaf plot and use it to find the mean and median of a set of numbers.
Knock-Knock. ¡Histograma cantante! Aquí para cantarte a tí acerca de toda la alegría y maravillas de lo que hacemos. ¿Te interesaría adquirir...
CAHSEE Math 6.5 Statistics, Data, and Probability II 192 Views
Share It!
Description:
Statistics, Data, and Probability II Drill 6 Problem 5. This graph is an example of a scatter plot with a what?
Transcript
- 00:04
Who ordered the shmoopy question?
- 00:08
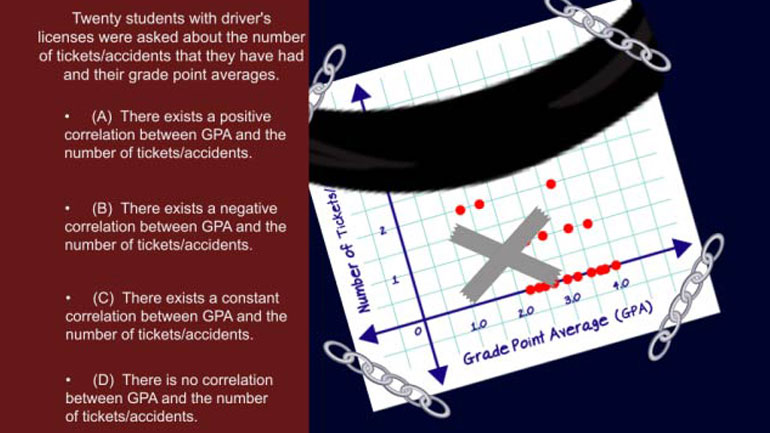
Mark kept track of the time he spent online each month for the past year.
- 00:11
Honestly, it’s unclear if he’s EVER seen the sun.
- 00:16
The graph below shows the time he spent online in hours and the cost of the internet access.
- 00:21
This graph is an example of a scatter plot with a… what?
Full Transcript
- 00:25
And here are the potential answers...
- 00:29
OK, so this question is adding a new vocab word to our pot of ‘em.
- 00:36
“Constant” – think: dead man’s pulse.
- 00:40
When things are constant… they don’t change. Like the revolving door of boobs in Congress.
- 00:46
So here, the cost of service does not change, no matter how much time Mark spends online.
- 00:52
It is a constant and the answer is C.
- 00:55
As in, “Censored.”
Related Videos
CAHSEE Math: Algebra and Functions Drill 5, Problem 3. Solve the equation.
Statistics, Data, and Probability I: Drill Set 3, Problem 4. How many different avatars can be created based on the given options?
Statistics, Data, and Probability II Drill 3 Problem 2. Which two sports together make up for the preferences of more than half of all those w...
Statistics, Data, and Probability II Drill 3 Problem 3. One hundred twenty of those who were asked preferred what sport?
