ShmoopTube
Where Monty Python meets your 10th grade teacher.
Search Thousands of Shmoop Videos
Texas EOC Videos 540 videos
AP U.S. History 1.1 Period 5: 1848-1877. Which of the following groups would be most likely to support the idea of Manifest Destiny?
In the 1950s and 60s, people weren't just expressing their feelings toward the government—they were singing them, too. (Think Crosby, Stills, Nas...
Deal or no deal? FDR's New Deal provided hundreds of thousands of jobs in the public sector to bring the economy out of the Great Depression. It wa...
ACT Science 1.3 Data Representation Passage 251 Views
Share It!
Description:
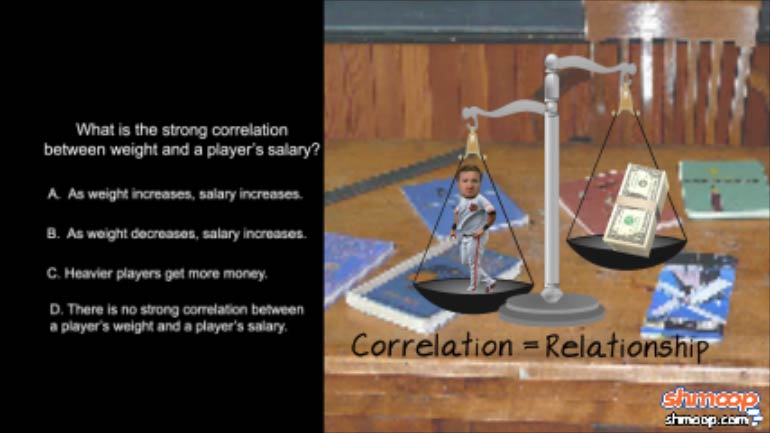
ACT Science: Data Representation Passage Drill 1, Problem 3. What is the strong correlation between weight and a player's salary?
Transcript
- 00:04
Here's your shmoop du jour, brought to you by the San Francisco Giants.
- 00:08
Beating them is a...tall order.
- 00:12
What is the strong correlation between weight and a player's salary?
- 00:29
And here are the potential answers...
- 00:33
This problem is asking us to figure out if there's some kind of correlation...
Full Transcript
- 00:36
or relationship...between player weight and salary.
- 00:40
If there is... we have our fingers crossed for Prince Fielder.
- 00:44
Anyway, it's instantly clear that we can use graph 2 to get our answer.
- 00:49
To figure out the relationship, we can look at the pattern the red dots make...
- 00:52
...or the lack of pattern?
- 00:57
They seem as all-over-the-place as Mr. Fielder's dietary habits.
- 01:01
It looks kind of like a negative relationship at first...
- 01:04
...increases...
- 01:07
...but then again everything sort of hovers equally around the middle.
- 01:11
Again... just like with Prince Fielder.
- 01:14
So...this lack of correlation means there is no strong correlation between a player's
- 01:19
weight and a player's salary.
- 01:21
Answer D is our answer!
- 01:24
Huge sigh of relief.
- 01:25
Keep packing away those M&M's, Prince.
Related Videos
ACT Science: Research Summary Passage Drill 2, Problem 1. Why do you think that the filter paper will not remove the salt from the water?
ACT Science: Conflicting Viewpoint Passage Drill 1, Problem 1. What statement would both scientists agree upon?
ACT Science: Data Representation Passage Drill 1, Problem 1. What do the statistics in Figure 1 suggest?
ACT Science: Data Representation Passage Drill 1, Problem 2. Which of the following is a variable in Figure 1, but not in Figure 2?
ACT Science Data Representation Passage: Drill 3, Problem 5. According to Figure 2, what birth date will be predicted for an individual actual...

